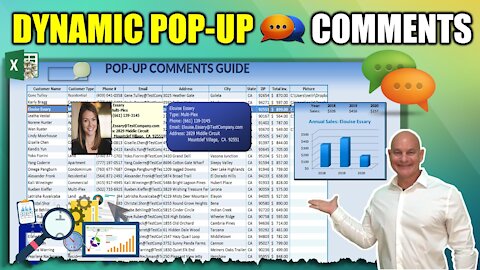
4 years agoHow To Create 4 Different Dynamic Pop-up Comments In Excel Including A ChartExcel For Freelancers
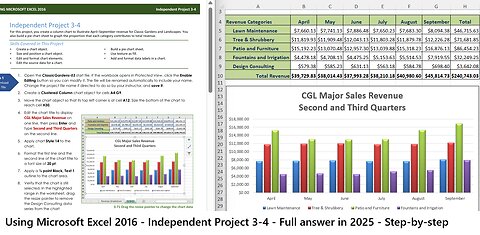
4 months agoUSING MICROSOFT EXCEL 2016 - Independent Project 3-4 - Classic Garden - Full answer in 2025saxi753
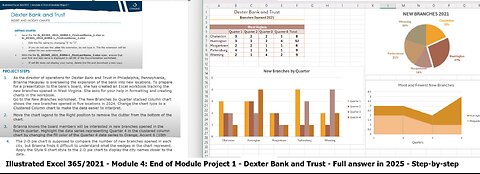
3 months agoIllustrated Excel 365/2021 | Module 4: End of Module Project 1 | Dexter Bank and Trust (Full 2025)saxi753
9 months agoSRS 172 | Travis Haley - Blackwater Sniper's Controversial Moments in Deadly War ZonesThe Sean Ryan ShowVerified
9 months agoTravis Haley - Blackwater Sniper's Controversial Moments in Deadly War Zones | SRS #172Shawn Ryan Show
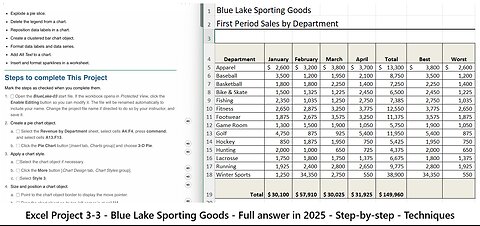
4 months agoExcel Project 3-3 - SIMnet - Blue Lake Sporting Goods - Full answer in 2025 - Step-by-stepsaxi753
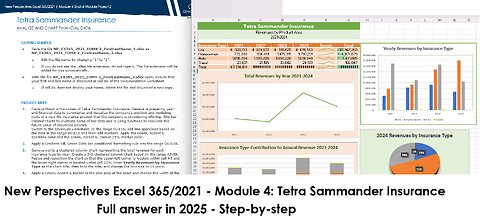
4 months agoNew Perspectives Excel 365/2021 | Module 4: End of Module Project 2 | Tetra Sammander Insurance 2025saxi753
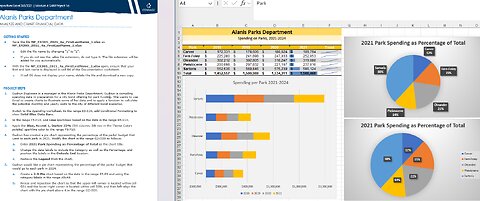
7 months agoNew Perspectives Excel 365/2021 | Module 4: SAM Project 1a | Alanis Parks Departmentsaxi753
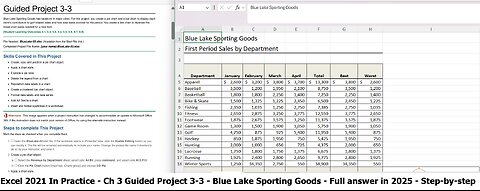
3 months agoExcel 2021 In Practice - Ch 3 Guided Project 3-3 - Blue Lake Sporting Goods (Update in 2025)saxi753
3 months agoPeeling Back the Layers: Epic Drops 10. Jason Breshears, Archaix 🎯LINKS IN DESC🎯AetherMedia22 Tony P
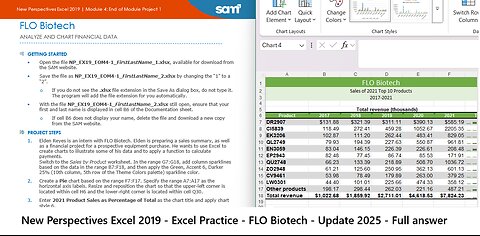
4 months agoNew Perspectives Excel 2019 | Module 4: End of Module Project 1 | FLO Biotech (Update 2025)saxi753
1 day agoExcel 2021 Ch 3 Guided Project 3-3 Tutorial - Blue Lake Sporting Goods (SIMnet Assignments/Projects)Academic_Helping_Buddy
7 months agoThe Ultimate Accounts Receivables & Payables Dashboard – From ScratchExcel For Freelancers
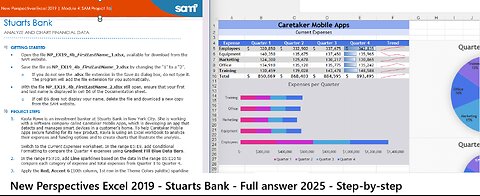
4 months agoNew Perspectives Excel 2019 | Module 4: SAM Project 1b | Stuarts Bank (Update 2025)saxi753
1 year ago🔬#MESExperiments 40: Replicating Viktor Schauberger's Rising Egg Experiment in REVERSEMath Easy SolutionsVerified