3 days ago3I/ATLAS's Orbit UNCHANGED by Massive Ongoing Solar Explosions 💥 Latest Breaking UpdatesSierraDelta
8 months agoHow to Make Money from Data Visualization | ڈیٹا ویزوالیزاشن سے پیسہ کمائیں | Zeeshan UsmaniZeeshan Usmani
1 day agoNancy Pelosi PANICS As CNN’s Dana Bash EXPOSES Her Fake Shutdown Lies LIVEFreedom FrontlineVerified
2 months agoWONDERCAST EP.83- ANTARCTICA (MYSTERIES, OPERATION HIGHJUMP & R.V. DATA) PART 2: LAW OF ONE BOOK 2 PAGES 123-133 SESSIONS 49 & 50 (CHAKRAS, KUNDALINI, ASCENSION & MEDITATION/VISUALIZATION/PRAYER)123MadAshVerified
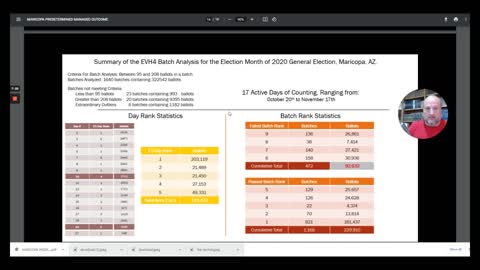
3 years agoMARICOPA ARIZONA 2020 Was A Predetermined Managed OutcomeOFFICIAL Jovan Hutton Pulitzer RumbleVerified
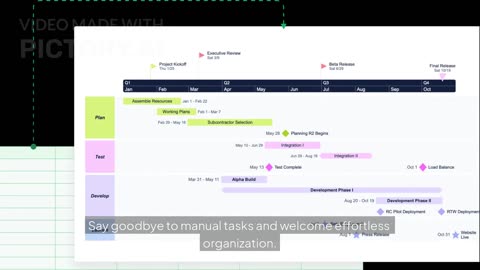
20 hours agoTurn Raw Project Data into Stunning Visual Timelines | Office Timeline Import & SyncPixiNews
4 years agoEpisode 1540 Scott Adams: Persuasion Lessons Taken From Today's Headlines. Find Out What You've BeenReal Coffee With Scott AdamsVerified
1 day agoFootball Club Ranking | Historical Top 10 & Top 100 (1872–2025, Men & Women)Football Club Ranking
22 days ago🪐 Stunning 4K Flyover of Mars’ Xanthe Terra Highlands | ESA Mars Express Data VisualizationBeyond Earth Academy
3 years agoMaricopa Civil Rights and Election Maladministration!OFFICIAL Jovan Hutton Pulitzer RumbleVerified