1 year agoThe Market Spy - Stock | Crypto Stream : Live $AMC, $APE, $HYMC, $GME, $SPY & $RUM $BTC, $DOGE, $SHIB, $ETH, $LTC, $MATIC, $ADA Charts with Lofi MusicThe Market SpyVerified
1 month agoBitcoin Targets New Highs, Tesla Stock Pumps & Payday Friday || The MK ShowMatt KohrsVerified
4 days agoStock Market Hits New Highs While Consumers Fall Behind: Adam Taggart on the US Economic SplitKitco NEWSVerified
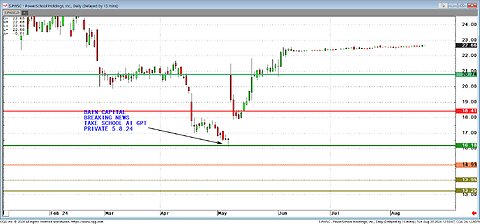
1 year agoHere Comes the Oil Trade! Stock Bottom = Cooties Bounce, Crypto Pullback AheadSnarky ChartsVerified
2 days agoRampant Insider Selling Signals The End Of The Bubble In Stocks | Jesse FelderAdam Taggart's Thoughtful Money
 6 watching6 watching