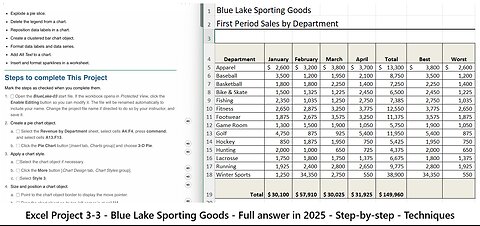
3 months agoExcel Project 3-3 - SIMnet - Blue Lake Sporting Goods - Full answer in 2025 - Step-by-stepsaxi753
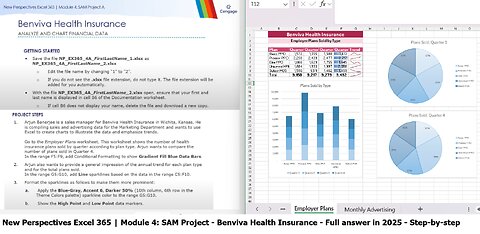
2 months agoNew Perspectives Excel 365 | Module 4: SAM Project A| Benviva Health Insurance (Full answer in 2025)saxi753
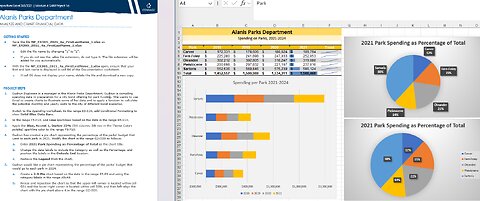
6 months agoNew Perspectives Excel 365/2021 | Module 4: SAM Project 1a | Alanis Parks Departmentsaxi753
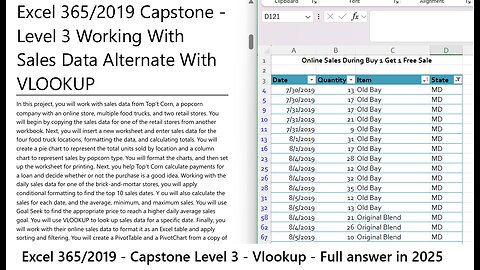
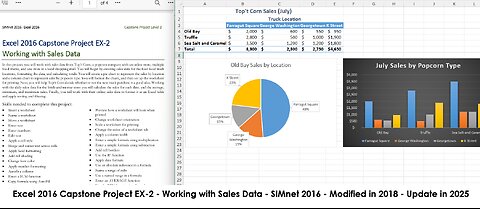
3 months agoSimnet 2016: Excel 2016 Capstone Project EX-2 - Working with Sales Data (Modified 2018, Update 2025)saxi753
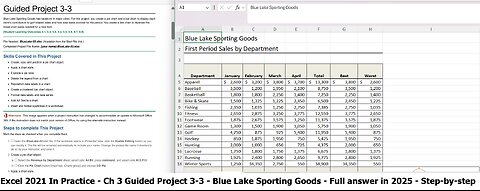
2 months agoExcel 2021 In Practice - Ch 3 Guided Project 3-3 - Blue Lake Sporting Goods (Update in 2025)saxi753
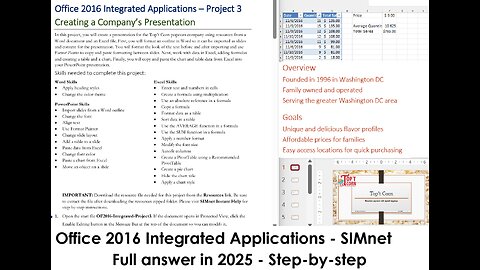
2 months agoOffice 2016 Integrated Applications Word, PPT, Excel– Project 3 Creating a Company’s Presentationsaxi753
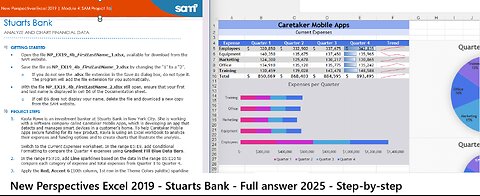
3 months agoNew Perspectives Excel 2019 | Module 4: SAM Project 1b | Stuarts Bank (Update 2025)saxi753
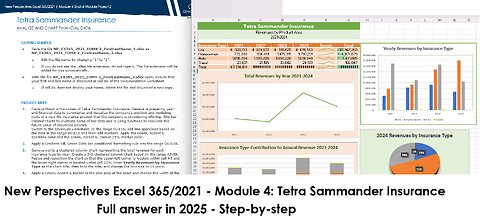
3 months agoNew Perspectives Excel 365/2021 | Module 4: End of Module Project 2 | Tetra Sammander Insurance 2025saxi753
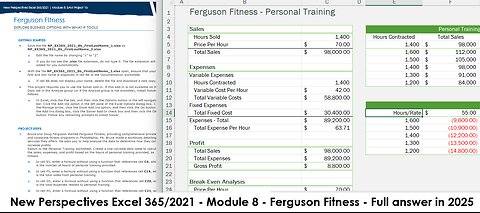
3 months agoNew Perspectives Excel 365/2021 | Module 8: SAM Project 1b | Ferguson Fitness (Update 2025)saxi753
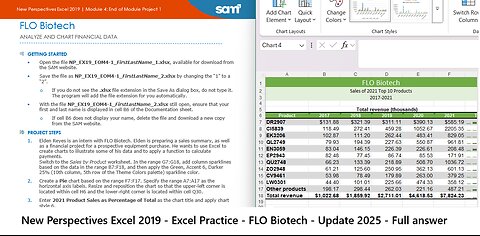
3 months agoNew Perspectives Excel 2019 | Module 4: End of Module Project 1 | FLO Biotech (Update 2025)saxi753
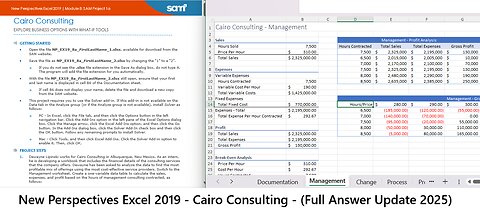
3 months agoNew Perspectives Excel 2019 | Module 8: SAM Project 1a | Cairo Consulting (Update 2025)saxi753
3 months agoShelly Cashman PowerPoint 2019 | Module 6: SAM Project 1a | Oakland College - Full answer 2025saxi753
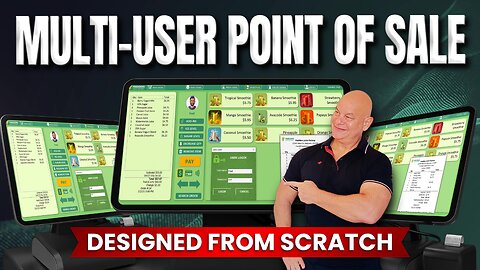
4 months agoHow To Create A Multi-User Point Of Sale (POS) In Excel (Designed From Scratch)Excel For Freelancers
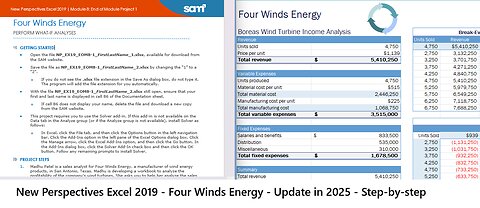
3 months agoNew Perspectives Excel 2019 | Module 8: End of Module Project 1 | Four Winds Energysaxi753
5 days agoJoe Oltmann Untamed | Guest Lori Gimelshteyn | Fight Against Leftism | 11.5.25UntamedNationVerified
2 months agoThe Top 10 Excel Inventory Management Hacks You Need To Know - WITHOUT VBAExcel For Freelancers
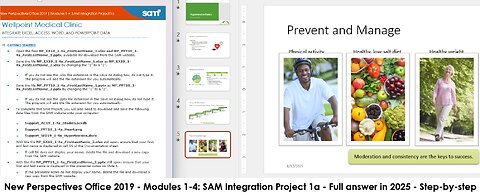
2 months agoNew Perspectives Office 2019 | Modules 1-4: SAM Integration Project 1a | Wellpoint Medical Clinicsaxi753