3 years agoAUSTRALIAN DEATHS ARE OFF THE CHARTS & GLOBO VS HUMAN - DIRECT COMPARISON (SHARE)Humanity Is Under Attack
1 year agoNew Paradigms, Time Travel, Building of the Pyramids, Accelerated Aging & more w/ Richard LighthouseBaggyPants
2 months agoThe Top 10 Excel Inventory Management Hacks You Need To Know - WITHOUT VBAExcel For Freelancers
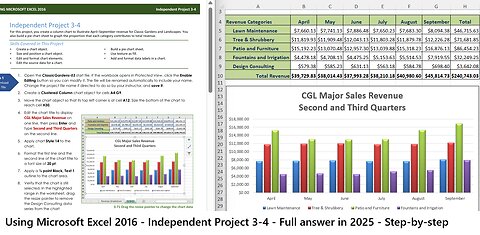
3 months agoUSING MICROSOFT EXCEL 2016 - Independent Project 3-4 - Classic Garden - Full answer in 2025saxi753
6 months agoThe Ultimate Accounts Receivables & Payables Dashboard – From ScratchExcel For Freelancers
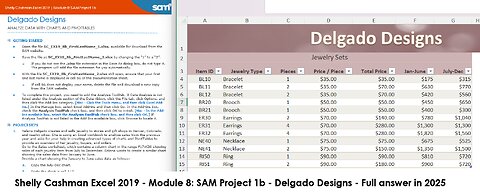
2 months agoShelly Cashman Excel 2019 | Module 8: SAM Project 1b | Delgado Designs (Full answer 2025)saxi753
6 years agoNew Information on 5g Near You & Dirty Secret Inside Telecommunications BillLeak ProjectVerified