The Democrat Election Denier Ultimate Playlist of Greatest Hits!
14 videos
Updated 6 months ago
Democrats often complain about Donald Trump & GOP election deniers (here's a mammoth amount of data chronicling Democrat Vote Fraud (written by yours truly), if you are interested https://archive.is/9qkHK https://archive.is/bEh4q ) when they've been playing the election denier/election denial card for decades.
Quite hypocritical, isn't it? They invented it!
-
Christina Bohannan & Marc Elias are ELECTION DENIERS! (Hub Video)
UTubekookdetectorChristina Bohannan & Marc Elias are ELECTION DENIERS! (Hub Video) https://nypost.com/2024/11/12/opinion/democratic-dirty-trickster-marc-elias-is-trying-to-steal-a-senate-seat/ https://jonathanturley.org/2021/02/05/the-return-of-marc-elias-the-lawyer-implicated-in-the-clinton-dossier-scandal-is-back-in-the-news/ https://iowademocrats.org/new-report-iowa-gop-bans-absentee-ballot-drop-boxes-health-crisis/ https://www.nrcc.org/2024/11/27/christina-bohannan-loses-recount-and-refuses-to-concede/ https://nypost.com/2024/11/26/us-news/dem-backed-recount-for-house-race-set-to-cost-taxpayers-20k-despite-gopers-insurmountable-lead/ https://x.com/IAFieldReport/status/1860084496621875626 Uh-oh folks, we have more Dumocrat election deniers – first we have the vacuous Marc Elias (and his numerous chins), a grifter of biblical proportions who was doing everything he could recently (and failed) to get Bob Casey enough votes to trigger a recount in Pennsylvania. Then they would do everything they could to try & find enough votes to steal a Senate seat. It didn’t work. Elias was front-and-center & knee-deep in the Steel Dossier flam-flam & also denied the results of a U.S. House election that saw Claudia Tenney victorious. I thought election denial was bad? Democrats invented it, it must be great, right? Marc Elias was so toxic & such a liar, even the DNC cut ties w/ him. How corrupt do you have to be before the DNC won’t even touch you? We also have this crazy troglodyte Christina Bohannan denying the results of the 2020 election between Rita Hart & Mariannette Miller-Meeks – falsely suggesting that because Iowa had a Republican Secy. of State (as an aside, the Democrat Party of Iowa went ballistic when they weren’t allowed to plant drop boxes all over Des Moines, Iowa City, Waterloo, etc. & conjure up enough fake votes to win some close races) Rita had her “victory” taken away. Sounds like election denial to me. Bonehead Bohannan also wasted about 20 grand in taxpayer money on a recount, which changed a handful of votes & she knew that’s what the result would be, but she wanted the specter of fraud to hang onto so she can grift some more & maybe make another failed run at political office. You see, in Iowa – Democrats can’t count on fake votes being deposited in drop boxes in the hood at 3 A.M., they can’t count on absentee ballots flowing in for two days after the election & they can’t count on local election officials to “cure” thousands of ballots after election day to find votes to win close races (Iowa fixed all this after 2020). Here are my previous videos on this topic, this will be the Hub Video & if I add anything else, it will be pinned in a comment on this video https://rumble.com/user/UTubekookdetector?q=election%20denier https://rumble.com/v3w1fip-wikipedias-democrat-election-deniers-get-called-out.html https://rumble.com/v2nux2c-election-deniers-cnn-and-divorcee-sam-seder-get-wrecked-by-donald-trump-vot.html https://rumble.com/v3goy0i-election-deniers-wonkette-vs-donald-john-trump.html https://rumble.com/v5dh3vv-election-denier-robert-reich-gets-pwned-by-rush-limbaugh-and-himself.html https://rumble.com/v35f4z4-donald-trump-vs-election-deniers-hillary-clinton-obama-nancy-pelosi-kamala-.html https://rumble.com/v3crzcc-election-denier-fani-willis-vs.-donald-john-trump.html https://rumble.com/v2lxv0y-election-denier-sam-seder-vs-rudy-giuliani.html https://rumble.com/v2sc8kw-election-denier-sam-seder-vs-scott-walker.html https://rumble.com/v2slknk-election-denier-jen-psaki-vs-chris-sununu.html PS Memo to Iowa Democrats, just because drop boxes have been used before (and they never mention to what extent, they don’t have the data & if they did it wouldn’t be what they want) doesn’t mean we should have them at every grocery store all over Des Moines, Iowa City, Waterloo, Cedar Rapids, Davenport, etc. What % of all votes were submitted in drop boxes in the 2008 election in Iowa that was not at a County Auditor’s office, do tell. Of course, they won’t. PPS Bonehead Christina Bohannan also is in favor of XY Chromosome predators who “change” their gender – hanging out in the same locker room w/ XX chromosome people, but I doubt she’ll ever be in a public restroom where a Roman Polanski type predator is hanging out in the next stall, but she doesn’t mind your daughter being in that position. That’s one of the reasons she lost, she’s sick in the head & probably a massive pervert, but being about 4 feet 11 inches tall, she’s going to let others do her dirty work. Good riddance Chris, now get a real job. Christina Bohannan isn't weird, she's a creepy midget.171 views 3 comments -
Divorcee Sam Seder Debunked on "Republican Voter Suppression"
UTubekookdetectorA talking point that is oft-repeated by mentally ill divorcees like Sam Seder #samseder #majorityreport gets debunked Republican Voter Suppression? Iowa https://www.ncsl.org/research/elections-and-campaigns/voter-id.aspx https://www.ncsl.org/research/elections-and-campaigns/voter-id-chronology.aspx https://ballotpedia.org/Voter_ID_in_Iowa https://apnews.com/article/f0591c6afacb4fb1b83e9bdae79740de https://www.radioiowa.com/2019/10/01/judge-upholds-id-requirement-for-election-day-voting-in-iowa/ https://uselectionatlas.org/RESULTS/ See the notes on some of these states as some Photo ID Voter laws were rolled out in phases and/or challenged in court by Democrats who want people willy-nilly voting sans any identification. I have provided some links to articles about these Voter ID/Photo ID Voting laws & it’s the same song from the Regressive Communists no matter what – voters are being suppressed & it is poor minorities who vote Democrat. They do not want people removed from voter rolls if they fail to vote in 3 Federal Elections, they do not want people giving any sort of identification (although a lot of states allow for numerous types of ID), they do not want ID’s presented, they do not want people disqualified from voting in the wrong precinct, they do not like it when there are not dropboxes everywhere for folks to dump dozens votes in at 3AM & if you don’t have a million early voting days & months & months of voting prior to Election Day they have a hissy fit. They do NOT want people being identified at the polls or anywhere else for that matter, period. Just autistically-repeating, “drop boxes increase turnout, therefore good unga bunga” is nonsense. I’m sure if the government dropped PSAs every hour on the hour to get free training for a firearm & purchase one, we would have a lot more folks buying guns, but doing X just to do X is nonsense. I will be focusing on POTUS elections years & also midterm elections. If the state I am examining does NOT have a gubernatorial race in a midterm, I will use the years (most Gubernatorial races are either at the midterm or a POTUS election) that they do have a Gubernatorial contest & compare those increases/decreases in turnout w/ national results. I am purposely going back to at least 1992 for POTUS elections (unless their voter id law does not go back very far) as the # of raw votes decreased in the next POTUS election cycle, we’ll compare that to increases/decreases in those states that are “engaging in Republican voter suppression.” Let us begin! Iowa 2000 IA POTUS election, total votes cast = 1,315,563 2004 IA POTUS election, total votes cast = 1,506,908 [+14.55%] 2008 IA POTUS election, total votes cast = 1,537,123 [+2.01%] 2012 IA POTUS election, total votes cast = 1,582,180 [+2.93%] *Iowa bucked the 2012 trend of less raw votes, but in 1996 about 120,000 less votes were cast, relative to 1992 (that was a national trend). Iowa also bucked the national trend in 2016, as less votes were cast, relative to 2012* 2016 IA POTUS election, total votes cast = 1,566,031 [-1.02%] 2002 IA Gubernatorial election, total votes cast = 1,025,802 2006 IA Gubernatorial election, total votes cast = 1,053,255 [+2.67%] 2010 IA Gubernatorial election, total votes cast = 1,122,013 [6.53% increase in total votes cast] 2014 IA Gubernatorial election, total votes cast = 1,131,258 [+0.825%] 2018 IA Gubernatorial election, total votes cast = 1,327,638 [+17.35%] ***Voter ID law fully implemented in 2019*** 2022 IA Gubernatorial election, total votes cast = 1,221,864 [-7.97%] 2020 IA POTUS election, total votes cast = 1,690,871 [+7.97%] Average increase/decrease in IA POTUS elections 2000-2020 = +5.288%. That is lower than the 2020 increase, sorry there is not more data to peruse, it is what it is. Average increase/decrease in IA Gubernatorial elections, 2002-2022 = +3.881%. That is much higher than the one gubernatorial election after the Photo ID law. Now, the bi-polar divorcee Sam Seder might say, “Aha, voter suppression.” Or it could be that the fat lady that Iowa Democrats nominated (because nobody apparently wanted this task) was a horrible speaker & a race trader that even her party could not get excited about. She had no political experience (not that it is necessarily bad) & it showed, a lot. Fred Hubbell at least was a successful businessman; he got a lot more votes than Deidre DeJear & the only folks who pulled the lever for her were already lifetime inmates in Crazy Town. It may not be voter suppression, but lack of excitement about a flawed candidate who had a deck full of race cards. *** Indiana 1992 IN Gubernatorial election, total votes cast = 2,229,116 1996 IN Gubernatorial election, total votes cast = 2,110,047 [-5.34%] 2000 IN Gubernatorial election, total votes cast = 2,179,268 [+3.28%] *2000 turnout LOWER than 1992 turnout* 2004 IN Gubernatorial election, total votes cast = 2,448,498 [+12.35%] 1992 IN POTUS election, total votes cast = 2,305,871 1996 IN POTUS election, total votes cast = 2,135,842 [-7.373%] 2000 IN POTUS election, total votes cast = 2,199,302 [+2.97%] *2000 turnout LOWER than 1992 turnout* 2004 IN POTUS election, total votes cast = 2,468,002 [+12.22%] Photo ID law christened by the SCOTUS, despite the grinding of yellow Democrat teeth 2008 IN Gubernatorial election, total votes cast = 2,703,752 [+10.42%] 2012 IN Gubernatorial election, total votes cast = 2,581,053 [-4.54%] 2016 IN Gubernatorial election, total votes cast = 2,719,968 [+5.38%] 2020 IN Gubernatorial election, total votes cast = 3,020,388 [+11.045%] 2008 IN POTUS election, total votes cast = 2,756,658 [+11.7%] 2012 IN POTUS election, total votes cast = 2,633,143 [-4.48%] 2016 IN POTUS election, total votes cast = 2,760,375 [+4.83%] 2020 IN POTUS election, total votes cast = 3,039,781 [+10.12%] Average decrease/increase in raw votes, IN Gubernatorial elections 1992-2020 = +4.656% [National average = +7.352%] Average decrease/increase in raw votes, IN Gubernatorial elections, AFTER VOTER ID, 2008-2020 = +5.576% [National Avg. = +7.829%] Average decrease/increase in raw votes, IN Gubernatorial elections PRIOR TO VOTER ID, 1992-2004 = +3.43% [National Average = +6.713%] Average decrease/increase in raw votes, IN POTUS elections 1992-2020 = +4.283% [National average = +6.465%] Average decrease/increase in raw votes, IN POTUS elections after VOTER ID LAW, 2008-2020 = +5.542% [National avg. = +6.888%] Average decrease/increase in raw votes, IN POTUS elections PRIOR TO VOTER ID LAW, 1992-2004 = +2.605% [National Average = +5.902%] It would be hard for bi-polaroids like the divorcee Sam Seder to argue that Photo ID requirements in Indiana are disenfranchising voters as their raw vote increases were much larger after they strengthened voting requirements. Notice how IN’s increases (relative to the baselines I established) were always lower than the national increases, they always lagged behind sans Voter ID or with it ensconced. *** Wisconsin 2000 WI POTUS election, total votes cast = 2,598,607 2004 WI POTUS election, total votes cast = 2,997,007 [+15.34%] 2008 WI POTUS election, total votes cast = 2,983,417 [-0.454%] 2012 WI POTUS election, total votes cast = 3,068,434 [+2.85%] *notice how their turnout increases/decreases in the 2008, 2012 & 2016 POTUS elections were contrary to the national trend* 1998 WI Gubernatorial election, total votes cast = 1,756,014 2002 WI Gubernatorial election, total votes cast = 1,775,349 [+1.1%] 2006 WI Gubernatorial election, total votes cast = 2,161,700 [+21.76%] 2010 WI Gubernatorial election, total votes cast = 2,160,832 [-0.04%] 2014 WI Gubernatorial election, total votes cast = 2,410,314 [+11.55%] Evil Photo ID law rolled out in WI 2016 WI POTUS election, total votes cast = 2,976,150 [-3.007%] 2020 WI POTUS election, total votes cast = 3,298,041 [+10.815%] 2018 WI Gubernatorial election, total votes cast = 2,673,308 [+10.907%] 2022 WI Gubernatorial election, total votes cast = 2,656,490 [-0.63%] Average increase/decrease in raw votes, WI Gubernatorial elections 1998-2022 = +7.411% [National Avg. = +8.320%] Average increase/decrease in raw votes, WI Gubernatorial elections, PRIOR TO PHOTO ID Law, 1998-2014 = +8.592% [National average = +2.851%] NOTE: I used 1998 as my baseline, so averaged the 2002, 2006, 2010 & 2014 election years, remember that! Average increase/decrease in raw votes, WI Gubernatorial elections, AFTER PHOTO ID Law, 2018 & 2022 = +5.138% [National average = +19.258%] Average increase/decrease in raw votes, WI POTUS elections 2000-2020 = +5.108% [National avg. = 8.844%] Average increase/decrease in raw votes, WI POTUS elections 2016 & 2020, AFTER PHOTO ID LAW = +3.904% [National avg. = 10.877%] Average increase/decrease in raw votes, WI POTUS elections, PRIOR TO PHOTO ID LAW, 2000-2012 = +5.912% [National average = +7.827%] I wish I had one more election cycle after Photo ID, I think it would be more informative & I tried to balance this out (equal number of cycles before & after) when I averaged it. A Democrat will definitely try to argue that WI’s voter ID laws are stifling turnout. A Republican could say, “You won WI in 2020 & won the Gubernatorial races in the last 2 cycles, what’s the problem?” There could still be voter suppression even if the party that is declaring it wins, just as voter fraud could still be a problem, even if Republicans do well. WI bucked national trends in 2008, 2021 & 2016 as noted above & two cycles were prior to Photo ID. ~13,500 less votes were cast in 2008 than in 2004 in Badgerville. Was that voter suppression or more likely the fact that Republican voters were NOT excited about John McCain as he received 215,000 less votes than George W. Bush 4 years prior? Combine that with turnout for Obama was much better than it was for the French-looking candidate, John Francois Kerry. *** Tennessee 1994 TN Gubernatorial election, total votes cast = 1,487,130 1998 TN Gubernatorial election, total votes cast = 976,236 [-34.354%] 2002 TN Gubernatorial election, total votes cast = 1,653,167 [+69.34%] 2006 TN Gubernatorial election, total votes cast = 1,818,549 [+10%] 2010 TN Gubernatorial election, total votes cast = 1,601,549 [-11.93%] 1992 TN POTUS election, total votes cast = 1,982,638 1996 TN POTUS election, total votes cast = 1,894,105 [-4.465%] 2000 TN POTUS election, total votes cast = 2,076,181 [+9.61%] 2004 TN POTUS election, total votes cast = 2,434,949 [+17.28%] 2008 TN POTUS election, total votes cast = 2,601,982 [+6.86%] ***2012 Photo ID law rolled out*** 2014 TN Gubernatorial election, total votes cast = 1,353,728 [-15.47%] 2018 TN Gubernatorial election, total votes cast = 2,243,294 [+65.71%] 2022 TN Gubernatorial election, total votes cast = 1,737,454 [-22.55%] 2012 TN POTUS election, total votes cast = 2,460,904 [-5.42%] 2016 TN POTUS election, total votes cast = 2,508,027 [+1.92%] 2020 TN POTUS election, total votes cast = 3,053,851 [+21.752%] Average increase/decrease in raw votes, TN Gubernatorial elections 1994-2022 = +8.678% [National avg. = +6.617%] Average increase/decrease in raw votes, TN Gubernatorial elections after evil Photo ID law rolled out, 2014-2022 = +9.23% [National Average = +10.010%] Average increase/decrease in raw votes, TN Gubernatorial elections PRIOR TO Photo ID law, 1994-2010 = 8.264% [National avg. = +4.075%] Average increase/decrease in raw votes, TN POTUS elections 1992-2020 = +6.791% [National avg. = +6.465%] Average increase/decrease in raw votes, TN POTUS elections AFTER VOTER ID, 2012-2020 = +6.084% [National avg. = +6.684%] Average increase/decrease in raw votes, TN POTUS elections PRIOR TO VOTER ID, 1992-2008 = +7.321% [National average = +6.301%] *** Mississippi 1999 MS Gubernatorial, total votes cast = 763,937 2003 MS Gubernatorial, total votes cast = 894,487 [+17.08%] 2007 MS Gubernatorial, total votes cast = 744,039 [-16.82%] 2011 MS Gubernatorial, total votes cast = 891,952 [+19.88%] 2000 MS POTUS election, total votes cast = 994,926 2004 MS POTUS election, total votes cast = 1,152,365 [+15.82%] 2008 MS POTUS election, total votes cast = 1,289,939 [+11.94%] 2012 MS POTUS election, total votes cast = 1,285,584 [-0.34%] ***2014 Voter ID law takes effect*** 2015 MS Gubernatorial, total votes cast = 718,185 [-19.48%] 2019 MS Gubernatorial, total votes cast = 884,911 [+23.21%] 2016 MS POTUS election, total votes cast = 1,211,088 [-5.79%] 2020 MS POTUS election, total votes cast = 1,314,475 [+8.54%] Average increase/decrease in raw votes, MS Gubernatorial contests 1999-2019 = +4.774% [National average = +4.262%] Average increase/decrease in raw votes, MS Gubernatorial contests PRIOR TO VOTER ID, 1999-2011 = +6.713% [National average = +2.831%] NOTE: Remember, on the national level I am also using 1999 as my baseline, so it’s the average increases in the 2003, 2007 & 2011 contests. Average increase/decrease in raw votes, MS Gubernatorial contests after Voter ID law 2015 & 2019 = +1.865% [National average = +19.191%] Average increase/decrease in raw votes, MS POTUS contests 2000-2020 = +6.034% [National avg. = 8.844%] Average increase/decrease in raw votes, MS POTUS PRIOR TO Voter ID, 2000-2012 = +9.14% [National avg. = +7.827%] Average increase/decrease in raw votes, MS POTUS after Voter ID 2016 & 2020 = +1.375% [National average = +10.877%] As is the case w/ TN, MS elections have seen wild fluctuations in raw vote totals sans or with a Voter ID Law. MS is an anomaly, while their 2012 turnout was lower, fitting w/ the national trend, their 2016 turnout plummeted in a state that has been leaning Republican (prior to 2010, the Democrats had a stranglehold on the State Legislature) for several years. Donald Trump received about 10,000 fewer votes than Romney yet won the state +17.5 & Romney won MS +11.5. This indicates both sides were not excited about their candidate, especially MS Democrats who flocked to vote for Barack Obama twice & abandoned elderly, wrinkled white trash Hillary Clinton in 2016. I wish I had one more post-Voter ID election to hash out as that would give us a better idea. For what it’s worth, their 1995 Gubernatorial tilt had a lot more votes cast than 4 years later. *** Kansas 1998 KS Gubernatorial, total votes cast = 742,665 2002 KS Gubernatorial, total votes cast = 835,690 [+12.52%] 2006 KS Gubernatorial, total votes cast = 849,700 [+1.689%] 2010 KS Gubernatorial, total votes cast = 838,790 [-1.286%] 1992 KS POTUS election, total votes cast = 1,157,236 1996 KS POTUS election, total votes cast = 1,074,300 [-7.167%] 2000 KS POTUS election, total votes cast = 1,072,216 [-0.195%] 2004 KS POTUS election, total votes cast = 1,187,756 [+10.78%] 2008 KS POTUS election, total votes cast = 1,238,873 [+4.3%] ***2012 Voter ID law enforced**** 2014 KS Gubernatorial, total votes cast = 869,502 [+3.66%] 2018 KS Gubernatorial, total votes cast = 1,054,622 [+21.299%] 2022 KS Gubernatorial, total votes cast = 994,477 [-5.705%] 2012 KS POTUS election, total votes cast = 1,157,532 [-6.57%] 2016 KS POTUS election, total votes cast = 1,197,570 [+3.46%] 2020 KS POTUS election, total votes cast = 1,377,484 [+15.02%] Average increase/decrease in raw votes KS Gubernatorial elections 1998-2022 = +5.362% [National average during those years = +8.320%] NOTE: I am using 1998 as my baseline, therefore I’m averaging the increases in raw totals for the 2002-2022 elections, REMEMBER THAT! I had to redo some totals because I made that mistake myself! Average increase/decrease in raw votes KS Gubernatorial elections PRIOR TO VOTER ID law, 1998-2010 = +4.307% [National average = +6.63%] Average increase/decrease in raw votes KS Gubernatorial elections after Voter ID law, 2014-2022 = +6.418% [National avg. = +10.010%] I did not include this, but the 1994 KS Governor’s race had a lot more votes cast then the 1998 edition. That would have skewed it more in my favor. Voter suppression or lack of interest in the candidates and/or the entire political process? Increases in raw votes for Gubernatorial contests increased substantially overall after Voter ID laws, making it hard for the Dummycrats to argue “voter suppression.” Yet, they are still making that argument in Kansas. Average increase/decrease in raw votes KS POTUS elections 1992-2020 = +2.84% [National avg. = +6.465%] Average increase/decrease in raw votes KS POTUS elections after evil Voter ID law, 2012-2020 = +3.97% [National avg. = +6.684%] Average increase/decrease in raw votes KS POTUS elections PRIOR TO evil Voter ID law, 1992-2008 = +1.929% [National average = +6.301%] The increases were higher after Voter ID, making it much more difficult to argue for “voter suppression.” KS’ increases prior to Voter ID in POTUS elections was lagging well behind national trends, so this is not news after Voter ID. *** North Dakota 2004 ND Gubernatorial, total votes cast = 309,873 2008 ND Gubernatorial, total votes cast = 315,692 [+1.88%] 2012 ND Gubernatorial, total votes cast = 317,812 [+0.675%] 2016 ND Gubernatorial, total votes cast = 339,601 [+6.857%] 2004 ND POTUS contest, total votes cast = 312,833 2008 ND POTUS contest, total votes cast = 317,738 [+1.57%] 2012 ND POTUS contest, total votes cast = 322,627 [+1.54%] 2016 ND POTUS contest, total votes cast = 344,360 [+6.735%] ***Voter ID law in 2018*** 2020 ND Gubernatorial, total votes cast = 357,659 [+5.319%] 2020 ND POTUS contest, total votes cast = 361,819 [+5.07%] Not a large swath of post-Voter ID info to cover, but for what it is worth. Average increase/decrease in raw votes, ND Gubernatorial Elections 2004-2020 = +3.682%. The 2020 increase was higher. Average increase/decrease in raw votes, ND POTUS Elections 2004-2020 = +3.728%. The 2020 increase was higher. I guess the voter suppression in ND will happen during Sam Seder’s next failed marriage. *** Georgia 1994 GA Gubernatorial, total votes cast = 1,545,297 1998 GA Gubernatorial, total votes cast = 1,792,882 [+16.02%] 2002 GA Gubernatorial, total votes cast = 2,028,251 [+13.13%] 2006 GA Gubernatorial, total votes cast = 2,124,598 [+4.75%] 1992 GA POTUS election, votes cast = 2,321,133 1996 GA POTUS election, votes cast = 2,299,071 [-0.95%] 2000 GA POTUS election, votes cast = 2,596,804 [+12.95%] 2004 GA POTUS election, votes cast = 3,304,481 [+27.25%] ***2008 Georgia Voter ID Law*** https://www.heritage.org/election-integrity/commentary/georgias-voter-id-lawsuit-seven-years-later-disenfranchised-or-still https://law.georgia.gov/press-releases/2011-03-08/georgia-supreme-court-declares-voter-id-law-constitutional 2010 GA Gubernatorial, total votes cast = 2,576,161 [+21.255%] 2014 GA Gubernatorial, total votes cast = 2,550,648 [-0.9904%] 2018 GA Gubernatorial, total votes cast = 3,939,409 [+54.996%] 2022 GA Gubernatorial, total votes cast = 3,953,408 [+0.3553%] 2008 GA POTUS election, votes cast = 3,932,158 [+18.995%] 2012 GA POTUS election, votes cast = 3,908,369 [-0.6049%] 2016 GA POTUS election, votes cast = 4,146,825 [+6.103%] 2020 GA POTUS election, votes cast = 4,999,960 [+20.573%] Average increase/decrease in raw votes, GA Gubernatorial contests prior to Voter ID law, 1994-2006 = +11.3% [National average = +3.599%] Average increase/decrease in raw votes, GA Gubernatorial contests 1994-2022 = +15.645% [National avg. = +6.617%] Average increase/decrease in raw votes, GA Gubernatorial contests after Voter ID law, 2010-2022 = +18.903% [National average = +8.911%] Average increase/decrease in raw votes, GA POTUS contests 1992-2020 = +12.045% [National avg. for 1992-2020 was +6.465%] Average increase/decrease in raw votes, GA POTUS contests after Voter ID law, 2008-2020 = +11.266% [National avg. during those same years = +6.888%] Average increase/decrease in raw votes, GA POTUS contests PRIOR TO Voter ID law 1992-2004 = +13.083% [National Average = +5.902%] Even after Voter ID/Photo ID laws, Georgia increases continued to outstrip national averages & in Governor’s clashes, it got even better. In POTUS races, their turnout increases weren’t as high after Voter ID, but still much better than the national average, so much for the voter suppression narrative in GA. *** Ohio 1994 OH Gubernatorial, total votes = 3,346,238 1998 OH Gubernatorial, total votes = 3,354,213 [+0.2388%] 2002 OH Gubernatorial, total votes = 3,228,992 [-3.733%] 1992 OH POTUS election, total votes = 4,939,964 1996 OH POTUS election, total votes = 4,534,434 [-8.209%] 2000 OH POTUS election, total votes = 4,705,457 [+3.772%] 2004 OH POTUS election, total votes = 5,627,908 [+19.603%] ***Voter ID law implemented in 2006*** https://www.nytimes.com/2006/11/01/us/politics/appeals-court-backs-ohio-on-voter-id.html https://publicintegrity.org/politics/elections/us-polling-places/ohio-voters-list-purges-strict-id-law-suppress-turnout/ 2006 OH Gubernatorial, total votes = 4,022,754 [+24.583%] 2010 OH Gubernatorial, total votes = 3,852,469 [-4.233%] 2014 OH Gubernatorial, total votes = 3,055,913 [-20.676%] 2018 OH Gubernatorial, total votes = 4,435,820 [+45.155%] 2022 OH Gubernatorial, total votes = 4,134,877 [-6.7842%] 2008 OH POTUS election, total votes = 5,721,831 [+1.67%] 2012 OH POTUS election, total votes = 5,590,934 [-2.287%] 2016 OH POTUS election, total votes = 5,536,547 [-0.973%] 2020 OH POTUS election, total votes = 5,932,446 [+7.15%] Average raw votes cast decrease/increase on OH Gubernatorial Elections 1994-2022 = +4.935% [National avg. = +6.617%] Average raw votes cast decrease/increase on OH Gubernatorial Elections after Voter ID legislation 2006-2022= +7.608% [National avg. = +8.424%] Average raw votes cast decrease/increase on OH Gubernatorial Elections PRIOR TO VOTER ID 1994-2002 = -1.747% [National avg. = +2.103%] I will again mention that Donald Trump being POTUS or being on the ballot caused a massive surge in turnout. Average raw votes cast decrease/increase on OH POTUS Elections 1992-2020 = +2.960% [National avg. for 1992-2020 was +6.465%] Average raw votes cast decrease/increase on OH POTUS Elections after Voter ID legislation 2008-2020 = +1.39% [National avg. during that time frame = +6.888%] Average increase/decrease in raw votes, POTUS elections for 1992-2004 = +5.902%. Ohio POTUS elections during that time frame = +5.055% Ohio has suffered (unless you are worried about overpopulation) from anemic population growth over the past couple decades, this could be the explanation as to why their vote increases are not on par w/ national trends, not voter suppression. Ohio average increases *always* lagged behind national trends as well, prior to or after Voter ID. I did not include this, but the 1990 OH Gubernatorial had a higher raw vote total than the 1994 Gubernatorial election & the national trend was the other way. To conclude that OH’s flagging number of voters going to the polls is because of “vote suppression” is the area of mentally ill conspiracy theorists like Sam Seder who want everyone to vote sans ID. *** National Data First, the midterm traditional Gubernatorial contests. Most Governors’ races are contested in these years 1994 Gubernatorial elections, total votes cast [36 contests] = 60,108,805 1998 Gubernatorial elections, total votes cast = 57,945,780 [-3.599% decrease in votes from prior election cycle] 2002 Gubernatorial elections, total votes cast = 62,469,272 [+7.806%] 2006 Gubernatorial elections, total votes cast = 66,511,382 [+6.471%] 2010 Gubernatorial elections, total votes cast [I omitted the votes in UT from the grand total as that was a special election] = 70,244,753 [+5.613%] 2014 Gubernatorial elections, total votes cast = 64,284,317 [-8.485%] 2018 Gubernatorial elections, total votes cast = 91,918,835 [+42.988%] 2022 Gubernatorial elections, total votes cast = 87,809,411 [-4.471%] Average raw votes cast decrease/increase, Midterm Gubernatorial elections 1994-2022 = +6.617% You can see how Donald Trump being POTUS or being on the ballot caused turnout to surge. Now for the Gubernatorial elections that take place in concert w/ POTUS contests 1992 Gubernatorial elections, total votes cast [11 contests, omitting RI due to their switch to 4-year terms after 1992, instead of 2-year terms] = 12,650,441 1996 Gubernatorial elections, total votes cast = 12,048,067 [-4.76%] 2000 Gubernatorial elections, total votes cast = 13,228,851 [+9.8%] 2004 Gubernatorial elections, total votes cast = 15,226,325 [+15.1%] 2008 Gubernatorial elections, total votes cast = 16,706,361 [+9.72%] 2012 Gubernatorial elections, total votes cast = 16,707,808 [+0.009%] 2016 Gubernatorial elections, total votes cast = 19,579,201 [+17.187%] 2020 Gubernatorial elections, total votes cast = 20,442,969 [+4.411%] Average raw votes cast decrease/increase, POTUS-Year Gubernatorial elections 1992-2020 = +7.352% Now for “off-year” Gubernatorial elections [KY, MS & LA have Gubernatorial contests in these years – I will omit any state (such as WV) that had “special elections” in these years] 1995 Gubernatorial elections, total votes cast = 3,353,628 1999 Gubernatorial elections, total votes cast (3 contests, KY, MS, LA) = 2,639,216 [-21.303%] 2003 Gubernatorial elections, total votes cast = 3,385,772 [+28.285%] 2007 Gubernatorial elections, total votes cast = 3,097,204 [-8.523%] 2011 Gubernatorial elections, total votes cast = 2,748,254 [-11.267%] 2015 Gubernatorial elections, total votes cast = 2,844,741 [+3.51%] 2019 Gubernatorial elections, total votes cast = 3,836,818 [+34.873%] Average raw votes cast decrease/increase, off-year Gubernatorial elections 1995-2019 = +4.2625% Now for POTUS elections 1992 POTUS election, total votes cast = 104,426,611 1996 POTUS, total votes cast = 96,275,640 [-7.805% decrease in votes relative to previous election cycle] 2000 POTUS, total votes cast = 105,425,985 [+9.504%] 2004 POTUS, total votes cast = 122,303,590 [+16.009%] 2008 POTUS, total votes cast = 131,473,705 [+7.498%] 2012 POTUS, total votes cast = 129,237,642 [-1.7008%] 2016 POTUS, total votes cast = 137,143,218 [+6.117%] 2020 POTUS, total votes cast = 158,590,894 [+15.6385%] Average raw votes cast decrease/increase, POTUS elections 1992-2020 = +6.465% You might ask, “Why are you not focusing on turnout averages?” There are a lot of states (Judicial Watch has exposed this more than a handful of times) that are lax at voter roll maintenance, failing to remove people who have moved, people who are dead, people who have not voted in a decade & they should not be on the voter rolls. If a Voter ID law is passed by State X, mentally-ill folks like Sam Seder, the drug-addled hippie w/ no teeth (Old Fart Rants) & the people they copy talking points from will say, “That be goin’ to suppress der vote.” When turnout spikes in the next few election cycles, they’ll still claim it, even when they have no proof. Not everyone who is not locked up in prison or an insane asylum should vote, period. There are a lot of low-information (unfortunately, I know some people who are successful, but refuse to vote because they’re lazy, disinterested, don’t want to do the necessary work to become informed (and some of them know this) or just do not care/do not think they will make a difference) idiots out there (we saw this in the Obama years as turnout waned in 2012 because many of his supporters realized that his ascendence to the White House did not result in their lives suddenly becoming better) who rarely vote or never vote. The Democrats do everything they can (even voting for them) to get them to the polls, everything but inform them on the issues. They give them some boilerplate talking points, some soft bigotry of low expectations – without government they cannot succeed. Imagine if they did the same amount of work Thomas Sowell did to make his decisions on whom to vote for or if they did the same amount of work my friend James Patrick Holding https://www.tektonics.org/lp/nowayjose.php did to conclude that Jesus Christ was The Word in the Flesh, born of a virgin & resurrected for his sins? They would be informed & likely would not be Democrats. But most people (even a lot of good people) do not want to do the necessary work – they’re lazy. Ergo, just focusing on turnout is a non-starter. Groomer Democrats are *consistently* whining about suppression, even if turnout spikes beyond levels seen prior to numerous states instituting some form of Voter ID Law. There are plenty of election deniers in the Dumocrat Party pushing the Big Lie, the lie of voter suppression, “not all the votes were counted” etc. https://rumble.com/v1ou9vw-kari-lake-decimates-the-democrat-media-on-the-big-lie.html They’ve been parroting The Big Lie about allegedly stolen elections for decades, now they’re accusing others of what they habitually do & screeching like banshees about voter suppression is par-for-the-course. *** Now for the grand finale, in states where I have enough, balanced data let us calculate them altogether (GA, IN, OH, KS & TN) versus national data. For all elections in those entities *after* a Voter ID/Photo ID law was ensconced in Gubernatorial & POTUS elections the avg. increase in raw votes was (this is 37 data points kids) +8.562%. The Population Standard Deviation was +17.779%. The NATIONAL average for POTUS elections (using 1992 as my baseline) & Gubernatorial elections (also using 1992 as my baseline or 1994 for midterms) for POTUS years & midterms (this is 21 data points) = +6.811%. The Population Standard Deviation was +11.164%. Raw voter turnout increased in the states that engaged in “voter suppression, although the swings (large decrease, followed by mammoth increase) were wilder than national data en masse. I could go further (If State A has raw vote increases that were below national averages prior to Voter ID & after Voter ID, that does not mean Voter ID is suppressing turnout), but I think this demonstrates that the states that cranked down (and where I had 3 elections prior to & after Voter ID) on potential voter fraud had raw vote increases larger than the national data en masse. This data is NOT perfect, but it is a good chink in the armor of bi-polaroids like the divorcee Sam Seder & his underemployed autistics who screech “voter suppression” whenever a Democrat loses an election. POTUS, Gubernatorial elections POTUS years & Midterm Gubernatorial elections -7.805 9.504 16.009 7.498 -1.7008 6.117 15.6385 -4.76 9.8 15.1 9.72 0.009 17.187 4.411 -3.599 7.806 6.471 5.613 -8.485 42.988 -4.471 Data for GA, IN, OH, KS & TN 21.255 -0.9904 54.996 0.3553 18.995 -0.6049 6.103 20.573 10.42 -4.54 5.38 11.045 11.7 -4.48 4.83 10.12 24.583 -4.233 -20.676 45.155 -6.7842 1.67 -2.287 -0.973 7.15 3.66 21.299 -5.705 -6.57 3.46 15.02 15.47 65.71 -22.55 -5.42 1.92 21.752 Let us add a few Democrat-leaning states for the bi-polaroid Sam Seder who has an affinity for Roman Polanski & see how they fared in vote increase/decreases. California CA 1994 Gubernatorial election, total raw votes = 8,665,375 CA 1998 Gubernatorial election, total raw votes = 8,381,871 [-3.2717%] CA 2002 Gubernatorial election, total raw votes = 7,474,030 [-10.831%] *Massive Declines in votes for 2 straight election cycles, Sam Seder’s bi-polar rage will be percolating over that “voter suppression” in the Golden State* CA 2006 Gubernatorial election, total raw votes = 8,679,416 [+16.1275%] CA 2010 Gubernatorial election, total raw votes = 10,095,485 [+16.315%] CA 2014 Gubernatorial election, total raw votes = 7,317,581 [-27.516%] CA 2018 Gubernatorial election, total raw votes = 12,464,235 [+70.333%] CA 2022 Gubernatorial election, total raw votes = 10,933,009 [-12.2848%] CA 1992 POTUS election, total raw votes = 11,131,721 CA 1996 POTUS election, total raw votes = 10,019,484 [-9.992%] CA 2000 POTUS election, total raw votes = 10,965,856 [+9.445%] CA 2004 POTUS election, total raw votes = 12,421,859 [+13.277%] CA 2008 POTUS election, total raw votes = 13,583,083 [+9.349%] CA 2012 POTUS election, total raw votes = 13,055,815 [-3.882%] CA 2016 POTUS election, total raw votes = 14,243,449 [+9.097%] CA 2020 POTUS election, total raw votes = 17,512,265 [+22.95%] CA average increase/decrease in raw votes POTUS election cycles = +7.177% CA average increase/decrease in raw votes Gubernatorial election cycles = +6.981% *** Illinois 1994 IL Gubernatorial election, total raw votes = 3,106,566 1998 Gubernatorial election, total raw votes = 3,358,657 [+8.115%] 2002 Gubernatorial election, total raw votes = 3,538,891 [+5.361%] 2006 Gubernatorial election, total raw votes = 3,487,989 [-1.44%] 2010 Gubernatorial election, total raw votes = 3,729,987 [+6.934%] 2014 Gubernatorial election, total raw votes = 3,627,690 [-2.741%] 2018 Gubernatorial election, total raw votes = 4,559,563 [+25.69%] 2022 Gubernatorial election, total raw votes = 4,107,075 [-9.924%] 1992 IL POTUS election, total raw votes = 5,050,157 1996 POTUS election, total raw votes = 4,311,391 [-14.628%] 2000 POTUS election, total raw votes = 4,742,123 [+9.99%] 2004 POTUS election, total raw votes = 5,274,322 [+11.224%] 2008 POTUS election, total raw votes = 5,530,179 [+4.85%] 2012 POTUS election, total raw votes = 5,251,432 [-5.04%] 2016 POTUS election, total raw votes = 5,595,279 [+6.548%] 2020 POTUS election, total raw votes = 6,049,500 [+8.119%] Illinois average increase/decrease in raw votes POTUS election cycles = +3.009% Illinois average increase/decrease in raw votes Gubernatorial election cycles = +4.570% *** New York 1994 NY Gubernatorial, total votes cast = 5,203,764 1998 Gubernatorial, total votes cast = 4,735,236 [-9.004%] 2002 Gubernatorial, total votes cast = 4,579,078 [-3.298%] 2006 Gubernatorial, total votes cast = 4,437,220 [-3.097%] 2010 Gubernatorial, total votes cast = 4,657,955 [+4.975%] 2014 Gubernatorial, total votes cast = 3,819,086 [-18.01%] *lower voter participation in 2014 than in 1998 or 1994! Must be voter suppression in the Empire State* 2018 Gubernatorial, total votes cast = 6,104,477 [+59.84%] 2022 Gubernatorial, total votes cast = 5,912,286 [-3.1482%] 1992 NY POTUS election, total votes cast = 6,926,925 1996 POTUS election, total votes cast = 6,316,129 [-8.818%] 2000 POTUS election, total votes cast = 6,831,178 [+8.155%] 2004 POTUS election, total votes cast = 7,391,954 [+8.21%] 2008 POTUS election, total votes cast = 7,640,948 [+3.369%] 2012 POTUS election, total votes cast = 7,081,536 [-7.321%] 2016 POTUS election, total votes cast = 7,721,795 [+9.04%] 2020 POTUS election, total votes cast = 8,632,255 [+11.791%] NY average increase/decrease in raw votes POTUS election cycles = +3.489% New York average increase/decrease in raw votes Gubernatorial election cycles = +4.036% *** If I now average out ALL the data from CA, NY & IL we have the following average decrease/increase in all POTUS & Gubernatorial (no special elections were allowed) elections = +4.877% & The Population Standard Deviation = +17.343% -9.992 9.445 13.277 9.349 -3.882 9.097 22.95 -3.2717 -10.831 16.1275 16.315 -27.516 70.333 -12.2848 -14.628 9.99 11.224 4.85 -5.04 6.548 8.119 8.115 5.361 -1.44 6.934 -2.741 25.69 -9.924 -8.818 8.155 8.21 3.369 -7.321 9.04 11.791 -9.004 -3.298 -3.097 4.975 -18.01 59.84 -3.1482 The Standard Deviation was close to the election average in the states that engaged in Voter ID/Photo ID/voter suppression, but their average/increase in raw votes was much lower than the national average & was lower than the states w/ tighter Voter ID laws – was that VOTER SUPPRESSION? In states that either do next-to-nothing to stop voter fraud (CA, NY, IL) or the states that cranked down on it (GA, IN, OH, KS & TN), their increases/decreases in raw votes swung wildly both ways, much more than the national average en masse. In conclusion, if you see a mentally ill, divorced, functionally retarded mouth breather screeching about “voter suppression” the data above indicates that is not true. I could give them all the raw data points & not tell them which batch was which (Voter ID states vs. CA, NY, or IL vs. national data) & they would not have a clue, or they would probably guess wrong. It reminds me of Tom Woods’ COVID-19 chart challenge https://www.covidchartsquiz.com/ where he shows graphs of states that had mask mandates & lockdowns vs. states that did not & he asks you to guess which ones are which & often the states w/ lower case rates per 100,000 did not have lockdowns. They can’t do it, they have to Monday Morning Quarterback it, they’re a “teach the test” person who can autistically-repeat talking points but once you get them off that they’re like a blind man in a dark room, flailing away like a madman. There is no truth to this “voter suppression” talking point (aside from creating a narrative) that divorced losers like Sam Seder repeat constantly because they don’t spend any time w/ their now ex-wife & kids, but they do spend a lot of time on social media. Mr. Chairman, I Yield Back! *** The mentally ill divorcee Sam Seder has already conceded to me -- he concurs that the most violent counties in America have lots of black on black homicide & they overwhelmingly vote Democrat. http://freewebs.com/professor_enigma/covid-increase-homicides Sam Seder is afraid to debate my friend James Patrick Holding on The Impossible Faith. https://tektonics.org/lp/nowayjose.php Methinks Stan Seder has no confidence in that religion degree from a diploma mill #samsederwontdebateJPH633 views 1 comment -
Election Denier Jamie Raskin denies that he's an election denier
UTubekookdetectorJamie Raskin, a little man w/ a Napolean Complex recently tried to feed us all a whopper – saying, “We’re not election deniers.” That takes some chutzpah to go out & say something like that, after all the garbage that your party has subjected America to. There are still some election deniers from decades ago, such as Maxine Waters, who is an election denier’s election denier. James McGovern of Massachusetts comes to mind as well, if my memory serves me correctly. There are a lot of Democrat election deniers from yesteryear that either expired or found something better to do, but the list is as long as the number of failed heterosexual relationships Sam Seder has had. #samseder #majorityreport BTW, that little rat is an election denier too! Raskin must be as senile as Joe Biden, doesn’t he remember the garbage that he spewed out of his pie hole for years, starting after Hillary Clinton’s defeat in 2016. Raskin saying there are no election deniers in his party is akin to NAMBLA saying there are no pedophiles among their ranks. https://www.pbs.org/newshour/show/of-mueller-report-rep-raskin-says-the-country-is-still-waiting https://nypost.com/2021/02/12/trump-defense-shows-clip-of-raskin-objecting-to-2016-results/ https://www.newsmax.com/newsmax-tv/jamieraskin-jan-6-election/2025/01/06/id/1194022/ https://jonathanturley.org/2024/11/03/were-not-going-to-allow-them-to-steal-it-raskin-repeats-trump-like-reservation-on-accepting-election-results/ Democrats invented election denial; their party is full of election deniers & the fact that they continue to criticize the GOP for rightly contending the 2020 POTUS election was a snow job is beyond foolish. I have the receipts for that contention as well. https://archive.ph/9qkHK https://archive.ph/bEh4q The Democrat election denier/election denial playlist https://rumble.com/playlists/SCR2FlyovGs PS Raskin had a tough time rationalizing his support for dementia-addled Joe Biden after some of his comments prior to his dismal debate performance against Donald J. Trump. Raskin, along w/ a slew of liars & snake oil salesmen, circled the wagons around this walking vegetable & I could tell Joe Biden – who was far from the smartest man in the room a quarter-century ago, was out of his gourd in 2020. He was cooked sausage, period. That all came out in June to everyone, even if you lacked sufficient brain-stem activity & if Raskin could’ve gotten away w/ it, he would’ve pushed this tomato can across the finish line one more time. Jamie Raskin lies so much, I wouldn’t believe this carnival-barker if his tongue were notarized. https://1a-1791.com/video/fwe1/b8/s8/2/l/G/M/d/lGMdw.caa.mp4 https://truthsocial.com/@realDonaldTrump/posts/113743523410330688125 views 1 comment -
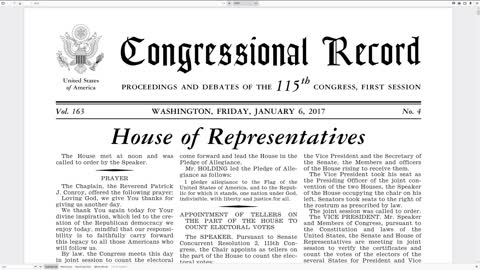
Democrats assault democracy -- dispute 2016 election
UTubekookdetectorWell, lookie here! Anyone remember the antique media screeching endlessly about an assault on democracy, an assault on the Republic, an assault on country in its entirety -- when several Democrats in the House rose to object to the 2016 election results & disputed electoral votes going to specific states because.... Russia. #stopthesteal I don't remember that either, but it happened in 2016. https://www.congress.gov/115/crec/2017/01/06/CREC-2017-01-06.pdf50 views -
David "Miss" Pakman Debunked Vol. I
UTubekookdetectorDavid “Miss” Pakman, along with countless other social media vegetables made a lot of hay out of especially Hillary Clinton’s popular vote victory, as well as Joe Biden’s popular vote win, which I do not question. I do however, question his victory in the electoral college. Been there, already examined that – see the links in the video description. Hillary Clinton’s margin of victory https://uselectionatlas.org/ in the Popular Vote was 2,868,524. Her margin of victory in 3 large, Dumocrat-dominated states w/ a lot of people who do not work (California, Illinois, New York) was 6,951,277, which was way beyond her popular vote victory. Joe Biden’s popular vote margin of victory was 7,060,520 & his margin of victory NY, CA & IL was 8,122,034. Even David Pakman is smart enough to see that those 3 states provided his margin of victory & outside those 3 states the candidate were basically even. Remember, those 3 states (IL, CA, NY) have a high % of residents that did not finish 9th grade. https://rumble.com/v1dmq69-brian-tyler-cohen-is-not-very-bright-part-v.html Those 3 states also have a high number of folks getting unemployment per 100,000 nonfarm jobs. I already ran the data for California in a response to a vanilla midget named Byron Taylor Cohen (see previous link), so let us add Illinois & New York. http://freewebs.com/professor_enigma/iowa-never-locked-down United States Data: There were ***1,757 continued claims (from week ending 3/27/2021 to 3/19/2022) per 100,000 nonfarm jobs.*** ***United States 2-year average (Continued Claims per 100,000 Nonfarm jobs/employment) = 1,156*** This is week ending 3/10/2018 to 3/9/2019 & week ending 3/16/2019 to 3/14/20. United States: There were (week ending 3/21/20 to 3/20/21) ***7,718 Continued Claims per 100,000 Nonfarm Employment jobs.*** United States ***Continued Claims per 100,000 nonfarm jobs (week ending 3/5/2016 to week ending 3/3/2018, seasonally adjusted) = 1,386.7*** California 2-year average (***Continued Claims per 100,000 Nonfarm jobs/employment) = 1,872*** Remember, that was week ending week ending 3/10/2018 to 3/9/2019 & week ending 3/16/2019 to 3/14/20 California ***Continued Unemployment Claims (week ending 3/5/2016 to week ending 3/3/2018) per 100,000 nonfarm jobs = 2,123.2*** There were ***11,924 Continued Claims (week ending 3/21/20 to 3/20/21) per 100,000 Nonfarm Employment jobs*** in California. California ***Continued Unemployment Claims per 100,000 Nonfarm Employment (in thousands) = 3,037*** continued claims (from week ending 3/27/2021 to 3/19/2022). Illinois: 2-year average (***Continued Claims per 100,000 Nonfarm jobs/employment) = 1,636*** (week ending 3/10/2018 to 3/9/2019 & week ending 3/16/2019 to 3/14/20) Illinois saw (week ending 3/21/20 to 3/20/21) ***8,309 Continued Claims per 100,000 Nonfarm Employment jobs.*** Illinois ***Continued Unemployment Claims per 100,000 Nonfarm jobs = 2,826*** (from week ending 3/27/2021 to 3/19/2022) Now let us add more data from IL that was not previously posted. IL average nonfarm employment (March 2016-February 2018) = 6,041.3 (thousands of jobs). IL Continued unemployment claims (week ending 3/5/2016 to week ending 3/3/2018) averaged 116,376.88. ***That equals 1,926.35 continued unemployment claims per 100,000 nonfarm jobs.*** Now for New York: 2-year average (***Continued Claims per 100,000 Nonfarm jobs/employment) = 1,390*** (week ending 3/10/2018 to 3/9/2019 & week ending 3/16/2019 to 3/14/20) New York (week ending 3/21/20 to 3/20/21) saw ***11,812 Continued Claims per 100,000 Nonfarm Employment jobs*** New York had ***2,598 continued claims (from week ending 3/27/2021 to 3/19/2022) per 100,000 nonfarm jobs*** Now adding some new data: NY avg. nonfarm employment (March 2016-February 2018) 9,517.62 (thousands of jobs). NY Continued Unemployment Claims (week ending 3/5/2016 to week ending 3/3/2018) avg. 155,378.65. ***That equals 1,632.53 continued unemployment claims per 100,000 nonfarm jobs*** Did you notice that on ALL those economic metrics those Democrat enclaves that gave Joe Biden & Hillary Clinton their popular vote victories were much higher than the U.S. average? New York Labor Force Participation Rate March 2018-February 2019 =60.6%. March 2019-February 2020 = 60.741%. March 2020-Feburary 2021 = 59.441% New York Labor Force Participation Rate April 2021-March 2022 = 59.191% Illinois Labor Force Participation Rate March 2018-February 2019 = 64.65%. March 2019-February 2020 = 64.3%. March 2020-Feburary 2021 = 62.441% Illinois Labor Force Participation Rate April 2021-March 2022 = 63.275% California Labor Force Participation Rate March 2018-February 2019 = 62.266%. March 2019-February 2020 = 62.366%. March 2020-Feburary 2021 = 60.208% California Labor Force Participation Rate April 2021-March 2022 = 61.3% Compare: Labor Force Participation Rate for the NON-LOCKDOWNS (IA, ND, SD, UT, WY, NE, AR – all GOP trifectas) April 2021-March 2022 = 65.953% March 2018-February 2020 Labor Force Participation Rate = 67.263% March 2020-February 2021 = 66.243% Much higher labor force participation rates & California is the “youngest” state as it has the highest % of its population that is under-65. In closing, Hillary & Biden’s popular vote victories ring hollow because Freeloader-ville is voting themselves a handout. Hillary, Biden & their cronies promised them a lot of free stuff from the public treasury if they vote for them. That is NY, CA & IL in a nutshell. Democrats do not like to work. This is part of the reason Joe Biden has committed treason by opening up our borders, they want more voters who do not work. They won’t work, but they will vote. That is their plan. Mr. Chairman, I Yield Back. PS http://freewebs.com/professor_enigma/end-the-electoral-college My debunking of David “Miss” Pakman & Regressive arguments against the Electoral College. I will add this example quickly: The EC is a hedge against Sharia Law. How, you ask? Glad you did! Let’s say California continues to allow immigration sans merit & instead of taking in freeloaders (who have no merit, which is what we want) from Latin America who drop out of school & do not work they bring in crazy, predator Muslims (is there any other kind?). California under the EC can only stuff the ballot for CA & the Electoral College blunts the amount of influence they have. Under a National Popular Vote scheme, you only need stuff the ballot in NY, CA & IL (3 states as I just covered that have a lot of freeloaders) to influence the entire election. The Electoral College prohibits that, to stuff the ballot they have to get freeloaders galore into states like Iowa, Florida, Texas, Utah, North Carolina, etc. David “Miss” Pakman does not like that, his unemployed voters in CA have their voice squashed by the Electoral College & it was designed that way. Thus, the example of Sharia Law being imported to California protects states like Iowa, which are not full of unemployed meth heads. If a Dumbasscrat brings up the fact that WV & MS are poor, yet typically vote Republican I will point out that those 2 states have been poor for a very long time & they used to vote Democrat….. A LOT!!! https://www.youtube.com/watch?v=mOZ9lNVjs1c https://professor_enigma.webs.com/democrat-election-fraud Take a gander at all the Democrat trifectas Ronald Reagan & George H.W. Bush won in the South.169 views -
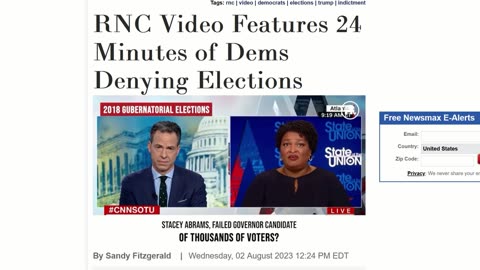
Wikipedia's Democrat election deniers get called out
UTubekookdetectorWikipedia's treasonous, baseless, ludicrous, disingenuous election deniers get called out by UTubekookdetector https://en.wikipedia.org/wiki/2016_United_States_presidential_election Wikipedia’s entry on the 2016 POTUS election mentions “Russia” or “Russian” (not including sources & footnotes) 30+ times & “Russian interference” was mentioned 6 times. Sounds like election denial, eh? https://en.wikipedia.org/wiki/Donald_Trump In its profile of Donald Trump, Wikipedia uses the term “election denial” & links to an essay https://en.wikipedia.org/wiki/Election_denial_movement_in_the_United_States that was hastily cobbled-together w/ a bevy of cut-and-paste sources to “prove” that Donald Trump’s claims about the 2020 election were false. They were not false though. https://web.archive.org/web/20220608034413/https://professor_enigma.webs.com/democrat-election-fraud https://web.archive.org/web/20220608034412/https://professor_enigma.webs.com/democrat-vote-fraud In their hasty, sloppy article on election denial they mention Kari Lake, https://en.wikipedia.org/wiki/Kari_Lake https://en.wikipedia.org/wiki/Stacey_Abrams but fail to mention the morbidly-obese Stacey Abrams. In their profile of Abrams they say, “She narrowly lost the election to Republican candidate Brian Kemp, but refused to concede, accusing Kemp of engaging in voter suppression as Georgia Secretary of State. News outlets and political science experts have been unable to determine whether voter suppression affected its result.” Contrast that w/ their just-so statements on the 2016 POTUS election & Russia’s role in it. Very disingenuous & amusing indeed. [I debunked a user on Gab named “LogicOnly” who was alleging Russian interference via spending on political ads & debunked that completely https://web.archive.org/web/20220513024507/https://professor_enigma.webs.com/archive ] In their election denier essay they say, “An October 2022 Washington Post analysis found that 51% of Republican nominees for House, Senate and key statewide offices in nearly every state that year denied or questioned the 2020 election outcome…As of August 2023, a large majority of Republican voters and Republican-leaning independents continued to believe Joe Biden was not legitimately elected in 2020.” Many Democrats falsely believed Donald Trump was an illegitimate President, but that was not included, was it? Why not? https://rumble.com/vj8jbz-latifah-faisal-story-county-iowa-supervisor-whines-about-the-jan.-6-insurre.html https://rumble.com/vhmkzl-latifah-faisal-vs.-utubekookdetector-stopthesteal-and-capitol-insurrection.html https://en.wikipedia.org/wiki/Hillary_Clinton In their “article” on Hillary Clinton & as they did w/ the obese Stacey Abrams, they do not use the term “election denier” or “election denial.” Neither Clinton nor Abrams were mentioned in their “essay” on election denial. Odd? https://en.wikipedia.org/wiki/Maxine_Waters Maxine Waters has a history of election denial, going all the way back on 2000, but Wikipedia fails to mention that history at all other than saying she objected to 3 POTUS elections on the House floor. Why didn’t they attach the election denier tag to her? Was it because her claims were B.S. and/or some of their idiots might get confused & think that Republicans did not invent election denial? Did Wikipedia do an analysis of Democrats in office or running for office & how many of them spewed forth misinformation & election denial after the 2016 POTUS election? Russia changed no votes, but that lie, The Big Lie has been spewed forth many times by Dumocrats. https://en.wikipedia.org/wiki/John_Lewis Noted grifter John Lewis was not tagged w/ the “election denier” label, despite his false statements about the 2016 POTUS election & Wikipedia fails to mention him in their election denier essay. Wikipedia also thinks we’re a democracy, so they flunked High School Civics, but they have a lot of company out there in that regard. https://en.wikipedia.org/wiki/Kamala_Harris The overweight Kamala Harris agreed w/ false statements made about so-called “Russian interference” in the 2016 election, yet she does not appear in Wiki’s “essay” on election denialism, nor do they tag her w/ the “election denier” label in their profile of her. Why not? https://en.wikipedia.org/wiki/Hakeem_Jeffries Mr. Magoo, aka Hakeem Jeffries parroted lies about the 2016 Presidential election more than once, yet he does not appear in Wikipedia’s essay on election denialism, nor do they mention it on his profile page. They do say this, “Jeffries voted to impeach President Donald Trump during both his first and second impeachments in the House. He repeatedly called Trump's presidency "illegitimate" due to the Russian interference in the 2016 United States presidential election.” I guess they did not call him an election denier because Wikipedia wants to keep that false talking point alive. So, why not just call him an “election denier”? You know the answer to that. https://en.wikipedia.org/wiki/Mike_Lindell Mike Lindell is taken to task for questioning the 2020 election, but James McGovern, https://en.wikipedia.org/wiki/Jim_McGovern_(American_politician) who spouted lies during the 2016 Electoral Vote tally was not labeled an election denier, nor did he appear in Wiki’s essay on election denialism. They did say this, “On January 6, 2017, McGovern objected to Alabama's electoral votes, which Donald Trump had won with 62.08% of the vote. Because no senator joined his objection, the objection was dismissed.” I ask again, why not tag him w/ the “election denier” label. They gave it two sentences & moved on. Why not? https://en.wikipedia.org/wiki/Sheila_Jackson_Lee Sheila Jackson Lee is a prominent election denier, but she is not mentioned in Wiki’s “essay” on election denialism. Why not? The profile of her on their site does mention in passing that she objected to 3 Presidential elections & even mentions 30 of her comrades throwing a hissy fit in 2005 over the count in Ohio. It’s funny that they mention the counting of votes in 2000 was “contentious”, but do not say the same thing about vote counting in 2020 in certain states. I wonder why? https://en.wikipedia.org/wiki/Barbara_Lee More of the same. They say the following about Barbara Lee but fail to call her an election denier: “After the 2016 presidential election, Lee objected to Michigan's and West Virginia's electoral votes. Because no senator joined her objections, they were dismissed.” https://en.wikipedia.org/wiki/Al_Gore https://en.wikipedia.org/wiki/Joe_Lieberman Uncle Albert Gore Jr., the Senator’s Son & his running mate Mr. Milquetoast Joe Liebermann were vocal on more than one occasion that the 2000 election was stolen from them, but they do NOT appear in Wiki’s article on election denialism & they are not dubbed as “election deniers” in their profile pages on Wiki either. They don’t call Gore an election denier, despite refusing to concede his loss until 12/13/00. After that, Gore has asserted several times over the years that the election was stolen from him. Is he fomenting domestic terrorism for refusing to admit that he lost? https://en.wikipedia.org/wiki/Barbara_Boxer Barbara Boxer is NOT mentioned in Wiki’s essay on election denialism, nor do they call her that on her profile page, yet: “On January 6, 2005, Boxer joined Representative Stephanie Tubbs Jones (D-Ohio) in filing a U.S. Congressional objection to the certification of Ohio's Electoral College votes in the 2004 U.S. presidential election. She called the objection her "opening shot to be able to focus the light of truth on these terrible problems in the electoral system". The Senate voted the objection down 74–1; the House voted the objection down 267–31. It was only the second Congressional objection to an entire State's electoral delegation in U.S. history; the first instance was in 1877.” https://en.wikipedia.org/wiki/Blake_Masters Blake Masters, who ran for Senate in Arizona is not called an election denier, but it is implied, “Masters has echoed Donald Trump's claims that the 2020 presidential election was "stolen". In June 2021, Masters said that "it's really hard to know" the winner of the 2020 presidential election, and supported an audit of the vote in Maricopa County. In a November 2021 campaign ad, Masters stated he thought "Trump won in 2020.” https://en.wikipedia.org/wiki/Ted_Cruz This is said about Ted Cruz: “After the January 2021 Capitol attack, Cruz received widespread political and popular backlash for objecting to the certification of Joe Biden's victory in the 2020 presidential election and giving credence to the false claim that the election was fraudulent. Cruz backed a failed appeal to the U.S. Supreme Court attempting to overturn or nullify the 2020 presidential election in Pennsylvania filed by U.S. Representative Mike Kelly, which argued that the Pennsylvania Constitution requires in-person voting except in narrow and defined circumstances; the Supreme Court of Pennsylvania had already rejected this argument. The U.S. Supreme Court declined to take up the case or issue an injunction and Pennsylvania's Electoral College votes were cast for Joe Biden. Cruz later led an effort by a group of Republican senators to refuse to count Pennsylvania's Electoral College votes, citing baseless allegations of fraud.” Were Boxer’s claims baseless? What about Jim McGovern’s claims or Al Gore’s claims or Sheila Jackson Lee? What about Maxine Waters? Did her claims receive popular backlash? Were her claims false? You can see how Wikipedia, America’s fact-free, heavily-edited “encyclopedia” treats Democrat election deniers with kid gloves, but when it comes to Ted Cruz, Kari Lake or Donald Trump, it’s different. https://en.wikipedia.org/wiki/Joe_Biden Even Joe Biden has engaged in election denial, insinuating that Al Gore really won the 2000 POTUS sweepstakes, but they don’t mention it in the senile Senator’s profile. Why not? https://en.wikipedia.org/wiki/January_6_United_States_Capitol_attack Lastly, Wikipedia’s essay on the so-called #INSURRECTION fails to mention all the protestors that got arrested at Donald Trump’s Inauguration, https://rumble.com/vj8jbz-latifah-faisal-story-county-iowa-supervisor-whines-about-the-jan.-6-insurre.html https://rumble.com/vhmkzl-latifah-faisal-vs.-utubekookdetector-stopthesteal-and-capitol-insurrection.html as well as all the violent demonstrations that broke out shortly after Hillary Clinton was defeated. I guess that was an Insurrection too, eh? But it’s not mentioned, why not? Why did Wikipedia not mention all the false claims made by Democrats in November 2016 that emboldened their unemployed base to engage in domestic terrorism? For four years we listened to Hillary Clinton, Nancy Pelosi, Jimmy Carter, Hakeem Jeffries, fat Kamala Harris, John Lewis, Maxine Waters, Dianne Feinstein, Marcia Fudge, Jamie Raskin, Sheila Jackson Lee, Ted Lieu, the overweight Jerry Nadler & a whole host of others. We listened to that bile for four years. https://rumble.com/v35f4z4-donald-trump-vs-election-deniers-hillary-clinton-obama-nancy-pelosi-kamala-.html Wikipedia forgot to mention that. My other videos on Democrat #electiondenial #electiondenier https://rumble.com/v2nux2c-election-deniers-cnn-and-divorcee-sam-seder-get-wrecked-by-donald-trump-vot.html https://rumble.com/v2sc8kw-election-denier-sam-seder-vs-scott-walker.html https://rumble.com/v2slknk-election-denier-jen-psaki-vs-chris-sununu.html https://rumble.com/v2lxv0y-election-denier-sam-seder-vs-rudy-giuliani.html https://rumble.com/v1ou9vw-kari-lake-decimates-the-democrat-media-on-the-big-lie.html https://rumble.com/vhmkzl-latifah-faisal-vs.-utubekookdetector-stopthesteal-and-capitol-insurrection.html https://rumble.com/v3goy0i-election-deniers-wonkette-vs-donald-john-trump.html [Are Democrats guilty of an Insurrection by writing the Electoral College, telling them to be “faithless electors”?] https://rumble.com/v3crzcc-election-denier-fani-willis-vs.-donald-john-trump.html https://rumble.com/vd1qg9-democrats-assault-democracy-dispute-2016-election.html #samseder #majorityreport545 views -
Election Deniers CNN & Divorcee Sam Seder get wrecked by Donald Trump voter
UTubekookdetectorCNN wants Donald Trump to stop talking about the 2020 election. Do they want Hillary Clinton, Jesse Jackson, Jamie Raskin, the obese Stacey Abrams, Nancy Pelosi, Maxine Waters, et al. to stop engaging in 2 decades of election denial? https://rumble.com/v1ou9vw-kari-lake-decimates-the-democrat-media-on-the-big-lie.html CNN & other election deniers like the divorcee Sam Seder #samseder #majorityreport on the Dumocrat side get wrecked by a Donald Trump supporter Just in case you were wondering, the 2020 election was a snowjob http://freewebs.com/professor_enigma/democrat-election-fraud If you live in a GOP trifecta, make sure you shore up your election laws prior to 2024 so the Democrats cannot stuff those blue ballot boxes w/ fake votes in 2024 Divorcee Sam Seder is afraid to debate me on why the most violent jurisdictions in America have loads of black on black murder & why they vote Democrat most of the time. Why is that? https://rumble.com/v2ahqta-divorcee-sam-seder-vs.-utubekookdetector-black-on-black-crime.html http://freewebs.com/professor_enigma/sam-seder-ilhan-omar-racism3152 views -
Election Deniers Wonkette vs Donald John Trump
UTubekookdetectorElection Deniers Wonkette vs Donald John Trump Don’t look now folks, the mouth-breathers at the “Wonkette” political rag are denying elections, having delusions of Russian Collusion grandeur, trying to intimidate the Electoral College into denying Donald Trump a victory, proclaiming that “Russia, which is Not A Ally, hacking our election in order to help its puppet win.” Yeah, they said that. Sound familiar? https://www.wonkette.com/p/electoral-college-officially-as-dumb-as-typical-trump-supporter https://archive.ph/j3oUe Should all the “Russia hacked the 2016 election” nutcases be brought into rural Idaho kangaroo courts & indicted for treason? https://rumble.com/v14jscv-gab-user-logiconly-gets-pwned-by-utubekookdetector.html [I debunked a user on Gab named “LogicOnly” on a number of items, one of them being “Russia used bots on Facebook”] The Wonkette thinks they have a great point when they mention that Trump said in 2012 that the Electoral College was bad for democracy. It doesn’t mean much. Yes, we are NOT a democracy, Trump was wrong to say that & the Electoral College is very anti-democracy. Trump should know that & the fact that he did not also does NOT detract from his victory over washed-up pizza maker & warmonger Hillary Clinton. Bad logic Wonkette, bad logic. E.G. Just because Donald Trump poo-pooed the Electoral College at one time & uses the word “democracy” does not detract from his victory. FDR declared that education was not a federal task, but only a state task. Does that mean Democrats will vote tomorrow to end the unconstitutional Federal Dept. of Education? https://www.youtube.com/watch?v=vsTPvxHKjPw The Federal Dept. of Education is unconstitutional, whether FDR says it is or not, my point being FDR’s disagreements on that issue w/ the Demoncrat Party today would not sway them, just as Donald Trump’s apparent ignorance of America as a “democracy”, instead of a “constitutional Republic” & anger at the Electoral College does not taint his victory in 2016. Other than that, the treasonous hacks at Wonkette were right & where are the indictments for people who called & read off pre-canned ham DNC rants to the Electoral College. Where are the indictments for those who wrote (in crayon) pre-canned ham DNC letters to the Electoral College telling them to stop Donald Trump. Fake electors? Where are the indictments for those who e-mailed DNC talking points to the Electoral College, telling them to select Hillary Clinton? I guess Wonkette does believe in “faithless electors.” Remember folks, when the Democrats cry about something, it’s usually because they did it first & are likely still doing it. *** https://web.archive.org/web/20230000000000*/https://professor_enigma.webs.com/end-the-electoral-college https://rumble.com/v1isntx-david-miss-pakman-debunked-vol.-i.html Debunking the Wonkette’s “point” about Hillary Clinton’s “victory” in the popular vote. *** Yes, the 2020 election was one of the most corrupt elections ever & I have the receipts https://web.archive.org/web/20230000000000*/https://professor_enigma.webs.com/democrat-election-fraud249 views 1 comment -
Election denier Robert Reich gets PWNED by Rush Limbaugh & himself!
UTubekookdetectorDon’t look now folks, Robert Reich was engaging in, back in 2018 – he was engaging in something that was anathema to society in 2020. https://www.newsweek.com/robert-reich-if-trump-guilty-his-presidency-must-be-annulled-opinion-1092345 Robert Reich was engaging in election denialism two years before the Democrats were aghast that Republicans would suggest that the 2020 election was a snow job. I have the receipts on that BTW. https://web.archive.org/web/20220608034413/https://professor_enigma.webs.com/democrat-election-fraud https://web.archive.org/web/20220608034412/https://professor_enigma.webs.com/democrat-vote-fraud Reich was in such a mentally ill rage that he was demanding the Supreme Court annul Donald Trump’s entire presidency. Isn’t that hilarious? He didn’t think impeachment & removal from office was enough, he was demanding Supreme Court annulment of Donald Trump’s entire presidency. All because of a fake, phony, contrived, Russia collusion hoax. If Robert Reich wonders why we don’t trust sociopaths like him, just remember Russia collusion & the “Hunter Biden laptop is Russian disinformation” talking point as well. https://rumble.com/v51c01o-creepy-old-man-sam-seder-and-ring-of-fire-is-fake-news-hunter-biden-laptop.html I have a number of videos https://rumble.com/user/UTubekookdetector?q=election%20denier exposing the Democrat/Progressive/Pedophile hypocrisy on “election denial”, which became “the Big Lie” in December 2020 & the following years. Remember, when Democrats accuse you of something, they are likely committing the atrocity themselves & when they accuse Donald J. Trump or myself of election denial or election denialism – they utilized that tactic numerous times prior to 2020. Democrats invented election denial & election denialism, period. These people want to stack the SCOTUS, so they can institute Chinese-style authoritarianism. That should scare you. https://rumble.com/v4ssglz-fascist-democrats-want-to-expand-the-scotus.html Robert Reich would stack the SCOTUS in a New York Minute to take away everyone’s firearms, except for the elite. https://www.yahoo.com/news/ex-labor-secretary-robert-reich-134508997.html He is so incensed by Elon Musk helping Donald J. Trump, he wants regulators to “threaten to arrest” him. This man is a Fascist. You don’t think Robert Reich et al. will be harassing Jon Tester & Sherrod Brown to break the Senate Filibuster? Should Robert Reich be arrested for spreading “Russia collusion” lies in 2016-2018? And lastly, here’s Reich going into a bizarro rage pertaining to election denial after 2020. https://robertreich.substack.com/p/the-most-important-litmus-test-of This is hilarious (and scary), you can’t make this dung up!!!134 views 3 comments -
Donald Trump vs Election Deniers Hillary Clinton, Obama, Nancy Pelosi, Kamala, Hakeem Jeffries et al
UTubekookdetectorDemocrats whine about Donald Trump & the election deniers #electiondenier but they invented election denying, they invented election denialism. Are any of the luminaries in the video above getting indicted for trying to overturn the 2000, 2004 and/or 2016 POTUS elections? Hello? Creepy bipolar divorcee Sam Seder #samseder #majorityreport debunked on "Republican Voter Suppression" aka being an election denier https://rumble.com/v24tyd2-divorcee-sam-seder-debunked-on-republican-voter-suppression.html Democrat vote fraud & potential vote fraud has been a problem for some time. The 2nd link is my analysis of the 2020 election https://web.archive.org/web/20220608034412/https://professor_enigma.webs.com/democrat-vote-fraud https://web.archive.org/web/20220608034413/https://professor_enigma.webs.com/democrat-election-fraud My previous videos on Democrat election deniers https://rumble.com/v2nux2c-election-deniers-cnn-and-divorcee-sam-seder-get-wrecked-by-donald-trump-vot.html https://rumble.com/v2sc8kw-election-denier-sam-seder-vs-scott-walker.html https://rumble.com/v2slknk-election-denier-jen-psaki-vs-chris-sununu.html https://rumble.com/v2lxv0y-election-denier-sam-seder-vs-rudy-giuliani.html https://rumble.com/v1ou9vw-kari-lake-decimates-the-democrat-media-on-the-big-lie.html https://rumble.com/vhmkzl-latifah-faisal-vs.-utubekookdetector-stopthesteal-and-capitol-insurrection.html *** BONUS: Overweight Sam Seder supporter #samseder #majorityreport Mark D. Lang should get the COVID-19 shot, as he is overweight. https://rumble.com/v2vn5na-utubekookdetector-vs-mark-lang-black-on-black-murder.html https://rumble.com/v2lnxy8-sam-seder-supporter-mdl61-gets-pwned-again.html https://rumble.com/v2bv0gy-sam-seder-supporter-mdl61-gets-pwned.html https://web.archive.org/web/20230622025906/https://professor_enigma.webs.com/what-s-new He obviously has a lot of free time & just sits at the computer all day, checking my channel numerous times, thumbing down any comments I make because he cannot debate. His only advantage is lots of free time. Go get another COVID-19 booster Mark! 😉535 views 1 comment