Out of Wedlock Births, Breakdown of the Nuclear Family
5 videos
Updated 5 months ago
The videos in this playlist will be dedicated (at least in part) to demonstrating how the nuclear family in these United States has taken a massive hit since the 1950s.
One of the facets of Communism (as well as Karl Marx and the Democrat Party) is to rid us of private property, as well as the nuclear family.
BLM removed a screed on their website prior to the 2020 election that was critical of the Westernized notion of the nuclear family.
The Black community has been ravaged (Asians do the best on this metric, but it's a nationwide problem) by men who refuse to stick around & raise their children.
Despite being a cultural problem, this has led to a lot of people who fail to join the labor force, don't contribute to the public treasury (but they make withdrawals) & become part of the permanent underclass, which is what the Democrat Party wants.
Paying people not to work & taxing them when they do has also exacerbated this problem, all done on purpose.
-
#blacklivesmatter Sam Seder & The Rock have something in common
UTubekookdetectorApparently #blacklivesmatter has scrubbed their website of some anti-nuclear family information, just in time for the election (lol). I would say that perhaps they’ve realized since the Black/African-American community has been ravaged by fatherless households, but they only did it because it might turn some folks off to their sociopathology. Don’t worry DUHwayne “The Rock” Johnson, don’t worry Sam Seder -- #blacklivesmatter #39144 isn’t good at nuclear families either. The only links you’ll need https://www.facebook.com/permalink.php?story_fbid=2967591673477229&id=1400591836843895 https://www.youtube.com/playlist?list=PLoA9J0G6s-6owc0S5klji-hEBtbAzbloB https://www.facebook.com/permalink.php?story_fbid=2909861932583537&id=1400591836843895 PS, if you want to read a short note about the “nuclear family” vs. the Biblical extended-family concept see the note on Luke 2:48-50 https://www.tektonics.org/TK-LK.php This was originally uploaded on YouTube back in October 2020 https://www.youtube.com/watch?v=ktSxzDraEDw117 views 1 comment -
Divorcee Sam Seder suddenly concerned about fatherless black children
UTubekookdetectorMy previous installment https://rumble.com/v1mt84s-more-information-on-out-of-wedlock-births-2010-2017.html More data on out of wedlock births for 2018 & 2019 (2020 data not out as of yet) https://www.cdc.gov/nchs/data/nvsr/nvsr70/nvsr70-02-508.pdf https://www.cdc.gov/nchs/data/nvsr/nvsr68/nvsr68_13-508.pdf In 2019 [Table 11 – Unmarried rates are births to unmarried women per 1,000 unmarried], 40% of births were to unmarried mothers overall for all races & origins, 28.2% for White, 70% for Black, 69% AI/AN, 11.7% Asian, 50.4% Native Hawaiian or Other Pacific Islander & 52.1% Hispanic. In 2018 [Table 11] all of the above in the same order: 39.6%, 28.2%, 69.4%, 68.2%, 11.7%, 50.4% & 51.8%. Can you see why a lot of black children “start at the bottom” to quote your vacuous, overweight VP Kamala Harris. The rate for Whites is appalling enough, but Black out of wedlock birth rates have been hovering around 70% for ~30 years. See the rate for Asians? That’s why Asian men are doing so well in America. They grow up in a house w/ 2 parents, both of which finished school. For Hispanics & especially Blacks, that is not the case. Sam Seder, you have a fragmented family if I remember correctly. Isn’t it sad that all of those groups except one have rates where 1 in 4 children are born out of wedlock. That was not the case for Black or Whites in the 1940s & 1950s. Today, America has turned into a fatherless child that is a drug addict. The Democrat Party is taking advantage of that by pushing policies that reward that behavior. America needs a massive dose of personal responsibility. In addition, I would take any story Sam Seder tells about another person’s alleged sinful proclivities w/ a grain of salt, I challenged him a long time ago to apologize to Roy Moore for perpetuating falsehoods he gleaned from the antique media. The divorcee Sam Seder has yet to apologize for that. https://rumble.com/v1g1qwv-divorcee-sam-seder-and-david-miss-pakman-owe-roy-moore-an-apology.html It's nice that the old man is finally concerned about fatherless children or mothers not named Bristol Palin who have kids sans marriage, but it’s a bit disingenuous as the Democrat Party base in places like Flint, Wilmington, Detroit, E. St. Louis, St. Louis, Chicago, Petersburg, Virginia, are people who have kids they are not taking care of. I remember when Sam Seder used to gleefully screech like a tween when a Republican would suffer a divorce & then in 2017, reality hit him like a runaway truck. Does that mean that Sam Seder’s criticisms of Rush Limbaugh or Newt Gingrinch’s infidelities are inadmissible? Using the oddly adolescent logic of Stan Seder his criticism would be invalid, because someone could just autistically-repeat “hypocrite” like Stan does. But I don’t have adolescent reasoning & I am not a social media vegetable like Stan Seder. What it does mean though is one of Sam’s gotcha arguments ended up coming back at him like a boomerang he tossed & then conveniently forgot about. Sam Seder has yet to debate my friend James Patrick Holding on The Impossible Faith. https://www.tektonics.org/lp/nowayjose.php Methinks Sam Seder has very little confidence in that religion degree from a diploma mill, it won’t stand up to intolerable scrutiny. #samsederwontdebateJPH Sam Seder has already conceded that the most violent jurisdictions in America have lots of black on black homicide, lots of fatherless children, lots of working age folks taking an extended break from the labor force & they overwhelmingly vote Democrat. https://www.facebook.com/permalink.php?story_fbid=2909861932583537&id=1400591836843895 #democratcrimewave #samseder #majorityreport409 views 2 comments -
More information on out-of-wedlock births (2010-2017)
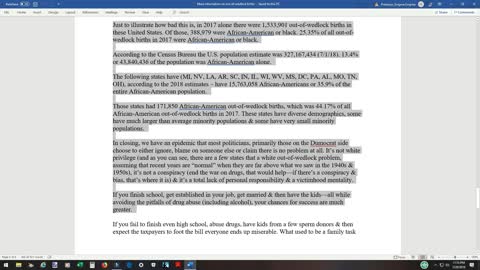
UTubekookdetectorOut-of-wedlock births (2010-2017) & demographic data for states https://www.cdc.gov/nchs/data/nvsr/nvsr67/nvsr67_08_tables-508.pdf https://www.cdc.gov/nchs/data/nvsr/nvsr67/nvsr67_01_tables.pdf https://www.cdc.gov/nchs/data/nvsr/nvsr66/nvsr66_01_tables.pdf https://www.cdc.gov/nchs/data/nvsr/nvsr64/nvsr64_12_tables.pdf https://www.cdc.gov/nchs/data/nvsr/nvsr64/nvsr64_01_tables.pdf https://www.cdc.gov/nchs/data/nvsr/nvsr62/nvsr62_09_tables.pdf https://www.cdc.gov/nchs/data/nvsr/nvsr62/nvsr62_01_tables.pdf https://www.cdc.gov/nchs/data/nvsr/nvsr61/nvsr61_01_tables.pdf https://www.census.gov/quickfacts https://web.archive.org/web/20120215184305/http://quickfacts.census.gov/qfd/index.html https://www.census.gov/quickfacts/fact/table/US,AL/PST045218 https://web.archive.org/web/20120215083534/http://quickfacts.census.gov/qfd/states/01000.html https://www.census.gov/quickfacts/fact/table/AR,US/PST045218 https://web.archive.org/web/20120215082733/http://quickfacts.census.gov/qfd/states/05000.html https://www.census.gov/quickfacts/fact/table/US,DE/PST045218 https://web.archive.org/web/20120222142735/http://quickfacts.census.gov/qfd/states/10000.html https://www.census.gov/quickfacts/fact/table/GA,US/PST045218 https://web.archive.org/web/20120215084613/http://quickfacts.census.gov/qfd/states/13000.html https://www.census.gov/quickfacts/fact/table/LA,US/PST045218 https://web.archive.org/web/20120215083554/http://quickfacts.census.gov/qfd/states/22000.html https://www.census.gov/quickfacts/fact/table/RI,US/PST045218 https://web.archive.org/web/20120217212947/http://quickfacts.census.gov/qfd/states/44000.html https://www.census.gov/quickfacts/fact/table/SC,US/PST045218 https://web.archive.org/web/20120215084930/http://quickfacts.census.gov/qfd/states/45000.html https://www.census.gov/quickfacts/fact/table/WV,US/PST045218 https://web.archive.org/web/20120217213442/http://quickfacts.census.gov/qfd/states/54000.html ********* USA average all races 2010-17 = 40.36% USA average Hispanic 2010-17 = 53% USA average White 2010-17 = 29% USA average Black 2010-17 = 71.1% Arkansas average, all races 2010-17 = 44.9125% Arkansas Black = 79.8625% Arkansas Hispanic = 50.075% Arkansas White = 34.6875% Delaware average, all races 2010-17 = 47.1875% Delaware Black = 71.1125% Delaware Hispanic = 62.5375% Delaware White = 35.45% Georgia average, all races 2010-17 = 45.275% Georgia Black = 70.375% Georgia Hispanic = 50.8375% Georgia White = 27.9125% Louisiana average all races 2010-17 = 52.8375% Louisiana Black = 79.625% Louisiana Hispanic = 55.5625% Louisiana White = 34.6625% New Mexico average, all races 2010-17 = 51.73% New Mexico Hispanic 2010-17 = 57.95% New Mexico Black 2010-17 = 55.41% New Mexico White 2010-17 = 30.56% Arizona average, all races 2010-17 = 45.1% Arizona Hispanic 2010-17 = 56.6% Arizona White 2010-17 = 30.5% Arizona Black 2010-17 = 62.4% Nevada average, all races 2010-17 = 46% Nevada Hispanic 2010-17 = 54.2% Nevada White 2010-17 = 34% Nevada Black 2010-17 = 72.8% Florida average, all races 2010-17 = 47.6% Florida Hispanic 2010-17 = 50.9% Florida White 2010-17 = 36.9% Florida Black 2010-17 = 69.2% District of Columbia, all races 2010-17 = 50.8% District of Columbia Hispanic 2010-17 = 61.2% District of Columbia Black 2010-17 = 78.1% District of Columbia White 2010-17 = 5.7% Mississippi average, all races 2010-17 = 54.07% Mississippi Hispanic 2010-17 = 54.52% Mississippi Black 2010-17 = 80.6% Mississippi White 2010-17 = 32.35% Rhode Island average, all races 2010-17 = 44.975% Rhode Island black = 64.5375% Rhode Island Hispanic = 63.3875% Rhode Island white = 35.975% South Carolina average, all races 2010-17= 46.8875% South Carolina black = 77.425% South Carolina Hispanic = 50.4% South Carolina white = 30.8% West Virginia average, all races 2010-17 = 44.6375% West Virginia black = 74.0625% West Virginia Hispanic = 46.475% West Virginia white = 43.65% Michigan average, black 2010-17 = 80.2125% Wisconsin average, black 2010-17 = 84.1% Illinois average, black 2010-17 = 79.5% Indiana average, black 2010-17 = 78.75% Ohio average, black 2010-17 = 78.0125% Ohio average, Hispanic 2010-17 = 60.3% Tennessee average, black 2010-17 = 77.8875% Missouri average, black 2010-17 = 76.975% Alabama average, black 2010-17 = 76.0625% Vermont average, white 2010-17 = 40.4% Maine average, white 2010-17 = 40.8125% Massachusetts average, Hispanic 2010-17 = 61.675% New York average, Hispanic 2010-17 = 63.8125% Pennsylvania average, Hispanic 2010-17 = 65.875% Pennsylvania average, black 2010-17 = 77.5625% Just to illustrate how bad this is, in 2017 alone there were 1,533,901 out-of-wedlock births in these United States. Of those, 388,979 were African-American or black. 25.35% of all out-of-wedlock births in 2017 were African-American or black. According to the Census Bureau the U.S. population estimate was 327,167,434 (7/1/18). 13.4% or 43,840,436 of the population was African-American alone. The following states have (MI, NV, LA, AR, SC, IN, IL, WI, WV, MS, DC, PA, AL, MO, TN, OH), according to the 2018 estimates – have 15,763,058 African-Americans or 35.9% of the entire African-American population. Those states had 171,850 African-American out-of-wedlock births, which was 44.17% of all African-American out-of-wedlock births in 2017. These states have diverse demographics, some have much larger than average minority populations & some have very small minority populations. In closing, we have an epidemic that most politicians, primarily those on the Dumocrat side choose to either ignore, blame on someone else or claim there is no problem at all. It’s not white privilege (and as you can see, there are a few states that a white out-of-wedlock problem, assuming that recent years are “normal” when they are far above what we saw in the 1940s & 1950s), it’s not a conspiracy (end the war on drugs, that would help—if there’s a conspiracy & bias, that’s where it is) & it’s a total lack of personal responsibility & a victimhood mentality. If you finish school, get established in your job, get married & then have the kids—all while avoiding the pitfalls of drug abuse (including alcohol), your chances for success are much greater. If you fail to finish even high school, abuse drugs, have kids from a few sperm donors & then expect the taxpayers to foot the bill everyone ends up miserable. What used to be a family task has now become—because of economically-illiterate politicians pandering for votes—a federal task. After trillions & trillions of welfare spending, cradle-to-grave entitlements & the like—America is experiencing an epidemic. The nuclear family is being annihilated and entities like Black Lives Matter, Bernie Sanders, et al place the blame on entrepreneurs when YOU are responsible for you. If you are a young woman it is your responsibility to be very picky when it comes to men because your livelihood may depend on it. Personal responsibility is an individual task & ala Smokey the Bear—only you can prevent fragmented families & bad relationships. More welfare & more “free” health care won’t cure the hardness & blackness of the human heart. Just as you cannot buy your way into heaven via an indulgence, you cannot buy success. Well, unless lobby Biden, Obama & Hillary Clinton to vote for your TARP bill, then you can buy some respite w/ a load of taxpayer cash. Have a nice day & you have been warned! #blackfathersmatter more than the terrorist group #blacklivesmatter169 views -
So, You're Nostalgic for the 1950s?
UTubekookdetectorOut-of-wedlock birth rate https://www.youtube.com/watch?v=p5pWdKMB4mE (11:05-15:39 see also links under “Out-of-wedlock births”) Federal Spending Per Capita, adjusted for inflation https://www.youtube.com/watch?v=Usc42LN3w4E National Debt, Federal Debt Per Capita, adjusted for inflation https://www.youtube.com/watch?v=aUjiuu5-4-A Individual Transfer Payments (inflation-adjusted dollars & as a % of all federal outlays) https://www.whitehouse.gov/omb/budget/Historicals/ (Table 11.1) Federal Spending; Mandatory Spending as a % of all federal outlays https://www.whitehouse.gov/omb/budget/Historicals/ (Tables 8.2 & 8.6) Means-tested entitlements as a % of all federal spending https://www.whitehouse.gov/omb/budget/Historicals/ (Table 8.2) https://www.whitehouse.gov/sites/default/files/omb/budget/fy2016/assets/hist_intro.pdf Labor Force Participation Rate https://www.youtube.com/watch?v=no9Rwi6CNuI (7:49-11:38) http://data.bls.gov/timeseries/LNS11300061 http://beta.bls.gov/dataViewer/view/timeseries/LNS11300164Q The rich didn’t pay those astronomical personal income tax rates of the 1950s https://fullerfiles.wordpress.com/2014/08/01/debunking-the-liberal-logic-on-taxes-in-the-1950s/ http://beingclassicallyliberal.liberty.me/2014/05/27/no-we-never-had-over-70-tax-rates-on-the-rich/ http://www.cbo.gov/sites/default/files/cbofiles/ftpdocs/98xx/doc9884/12-23-effectivetaxrates_letter.pdf http://www.fas.org/sgp/crs/misc/R42111.pdf http://www.irs.gov/uac/SOI-Tax-Stats-Individual-Statistical-Tables-by-Tax-Rate-and-Income-Percentile#_grp1 http://www.irs.gov/pub/irs-soi/51-86inintxshatr.pdf Homeownership rate data/HUD Spending http://www.census.gov/housing/hvs/data/histtabs.html http://www.census.gov/housing/hvs/data/histtab14.xls http://research.stlouisfed.org/fred2/series/USHOWN/ http://www.census.gov/hhes/www/housing/census/historic/owner.html http://www.downsizinggovernment.org/charts/ Federal Receipts by source, % of https://www.whitehouse.gov/omb/budget/Historicals/ (Table 2.2) Federal Personal Income Tax Rates, Federal Corporate Income Tax Rates & FICA/HI (Social Security & Medicare) Tax Rates http://taxfoundation.org/article/social-security-and-medicare-tax-rates-calendar-years-1937-2009 http://taxfoundation.org/article/federal-corporate-income-tax-rates-income-years-1909-2012 http://taxfoundation.org/article/us-federal-individual-income-tax-rates-history-1913-2013-nominal-and-inflation-adjusted-brackets 1) Out of wedlock birth rate 2) Federal Debt Per Capita 3) Federal Spending Per Capita 4) Federal Transfer Payments to Individuals 5) Means-Tested Spending 6) So-called Mandatory Spending 7) Labor Force Participation Rates 8) Homeownership Data 9) Sources of Federal Tax Revenue 10) Personal Income Tax Rates (taking a special look at years where those rates were changed) 11) Various Personal Income Tax Data (dispelling certain Progressive myths concerning personal income tax rates of the 1950s)91 views -
Ann Coulter was right about single mothers & pop cultural decay
UTubekookdetectorSome tough love from Ann Coulter during the Obama Administration Ann Coulter was right about single mothers & pop cultural decay If any of these links don’t work, try plugging the link into https://web.archive.org/ or https://archive.is/ Originally uploaded on YouTube in 2013 & was a follow up to https://web.archive.org/web/20250000000000*/https://www.youtube.com/watch?v=Aq3n4CsMx8k The background material STDs or STI infection rates http://www.cdc.gov/std/stats/STI-Estimates-Fact-Sheet-Feb-2013.pdf Out-of-wedlock births http://www.census.gov/hhes/families/data/cps2011.html http://www.washingtontimes.com/news/2012/dec/25/fathers-disappear-from-households-across-america/ http://familyfacts.org/charts/205/four-in-10-children-are-born-to-unwed-mothers http://www.cdc.gov/nchs/fastats/unmarry.htm http://www.cdc.gov/nchs/data/nvsr/nvsr61/nvsr61_05.pdf http://www.census.gov/prod/2013pubs/acs-21.pdf Abortion statistics http://www.abort73.com/abortion/abortion_and_race/ http://www.guttmacher.org/pubs/US-Abortion-Patients.pdf Federal Spending figures http://www.whitehouse.gov/omb/budget/Historicals (tables 8.6, 11.3, 11.1)110 views 2 comments