-
Axis Corp. is studying two mutually exclusive projects. Project Kelvin involves an
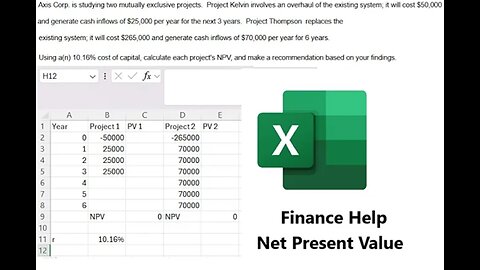
saxi753Axis Corp. is studying two mutually exclusive projects. Project Kelvin involves an overhaul of the existing system; it will cost $50 comma 000 and generate cash inflows of $25 comma 000 per year for the next 3 years. Project Thompson replaces the existing system; it will cost $265 comma 000 and generate cash inflows of $70 comma 000 per year for 6 years. Using a(n) 10.16% cost of capital, calculate each project's NPV, and make a recommendation based on your findings. #NetPresentValue #FinanceHelp #Finance #Techniques23 views -
Independent Project 3-5 Microsoft Access - SimNet Project: The New York Department of Motor Vehicles
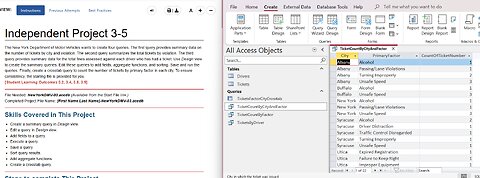
saxi753Independent Project 3-5 The New York Department of Motor Vehicles wants to create four queries. The first query provides summary data on the number of tickets by city and violation. The second query summarizes the total tickets by violation. The third query provides summary data for the total fines assessed against each driver who has had a ticket. Use Design view to create the summary queries. Edit these queries to add fields, aggregate functions, and sorting. Save and run the queries. Finally, create a crosstab query to count the number of tickets by primary factor in each city. To ensure consistency, the starting file is provided for you. [Student Learning Outcomes 3.2, 3.4, 3.8, 3.9] File Needed: NewYorkDMV-03.accdb (Available from the Start File link.) Completed Project File Name: [First Name.Last Name]-NewYorkDMV-03.accdb Skills Covered in This Project Create a summary query in Design view. Edit a query in Design view. Add fields to a query. Execute a query. Save a query. Sort query results. Add aggregate functions. Create a crosstab query. Steps to complete This Project Mark the steps as checked when you complete them. Open the NewYorkDMV-03.accdb database start file. The file will be renamed automatically to include your name. Change the project file name if directed to do so by your instructor. Enable content in the database. Create a new summary query in Design view. The query counts the number of tickets issued by city and violation. Add the Tickets table into the Query Design window. Increase the size of the table object to display all of the fields. Add the following fields into the query: City, PrimaryFactor, and TicketNumber. Add the Total row to the query. Group By the City and PrimaryFactor fields and Count the TicketNumber field. Save the query as TicketCountByCityAndFactor. Run the query. The datasheet should display 22 records. Adjust the field column widths using AutoFit or Best Fit. The datasheet should be similar to Figure 3-116. Datasheet view of query results shows 22 records. Figure 3-116 Summary query results counting tickets by city and factor Save the changes to the query. Save a copy of the query as TicketCountByFactor. Edit the TicketCountByFactor query in Design view. The query should show the total tickets issued for each violation factor, sorted in descending order by count. Delete the City field. Sort the TicketNumber field in descending order. Save and run the query. The datasheet should match Figure 3-117. Datasheet view of query results shows nine records. Figure 3-117 Summary query results counting tickets by factor Close the query. Create a new summary query in Design view. The query provides summary data on the total fines assessed against each driver. Add both tables into the Query Design window. Increase the size of the table objects to display all of the fields. Add the following fields into the query: LicenseNumber, FirstName, LastName, Fine, and TicketNumber. Add the Total row to the query. Group By the LicenseNumber, FirstName, and LastName fields, Sum the Fine field and Count the TicketNumber field. Sort the Fine field in descending order. Save the query as TicketsByDriver. Run the query. The datasheet should display 23 drivers who have received tickets, sorted in descending order by the total dollar amount of their fines (Figure 3-118). Datasheet view of query results Figure 3-118 Summary query results of tickets by driver Close the query. Create a crosstab query to count the number of tickets by city and primary factor. Launch the Query Wizard, select Crosstab Query Wizard and click OK. Refer back to SLO 3.9: Understanding and Building a Crosstab Query if you need additional guidance. Select the Tickets table, on the first page of the wizard, because that contains the data you want to summarize. Move the PrimaryFactor field to the Selected Fields window, on the second page of the wizard, to use as the row headings. Select the City field, on the third page of the wizard, to use as the column headings. Select the TicketNumber field and the Count aggregate function, on the fourth page of the wizard. Leave the Yes, include row sums check box selected. Enter TicketsFactorCityCrosstab as the query name on the last page of the wizard. Click Finish to execute the query. The results should match those shown in Figure 3-119. Datasheet view of crosstab query results showing tickets by primary factor in each city, including row sums Figure 3-119 Crosstab query results showing tickets by primary factor in each city, including row sums Save and close the query. Close the database. Upload and save your project file. Submit project for grading. #MicrosoftAccess #Access #SimNet #Project25 views -
Microsoft Access - Independent Project 1-4 - Update from 2024 - Step-by-step - Table, External Data
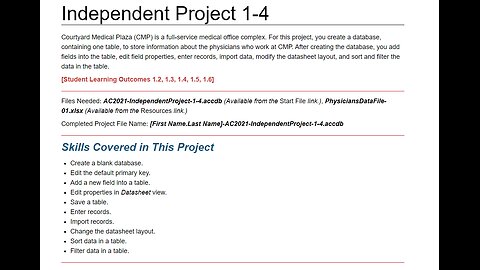
saxi753Independent Project 1-4 Courtyard Medical Plaza (CMP) is a full-service medical office complex. For this project, you create a database, containing one table, to store information about the physicians who work at CMP. After creating the database, you add fields into the table, edit field properties, enter records, import data, modify the datasheet layout, and sort and filter the data in the table. [Student Learning Outcomes 1.2, 1.3, 1.4, 1.5, 1.6] Files Needed: AC2021-IndependentProject-1-4.accdb (Available from the Start File link.), PhysiciansDataFile-01.xlsx (Available from the Resources link.) Completed Project File Name: [First Name.Last Name]-AC2021-IndependentProject-1-4.accdb Skills Covered in This Project Create a blank database. Edit the default primary key. Add a new field into a table. Edit properties in Datasheet view. Save a table. Enter records. Import records. Change the datasheet layout. Sort data in a table. Filter data in a table. Steps to complete This Project Mark the steps as checked when you complete them. Open the AC2021-IndependentProject-1-4 database start file. Enable content in the security warning. Note: If a Security Risk message displays when opening your database, please do the following: Navigate to where you saved your file. Right-click the file and select Properties. Check the Unblock check box on the General tab. Click Apply and click OK. The file will be renamed automatically to include your name. Change the project file name if directed to do so by your instructor. Edit the default primary key and add new fields into the table. Open Table1 and change the ID field name to DoctorID. Keep this field as an AutoNumber data type. Enter the remaining fields into the table using the information in Table 1-16. After you enter the last field name, MoveInDate, press the down arrow key to move to the first column of the append row. Table 1-16 This table lists the different data types to select and the field names to be typed in each of the fields Data Type Field Name Short Text LastName Short Text FirstName Short Text OfficeNumber Short Text PrimarySpecialty Date & Time MoveInDate Save the table as Physicians. Edit the field properties of the Physicians table using the information in Table 1-17. Table 1-17 This table lists the different field names and the associated text to be typed in the Caption and Size properties Field Name Caption Size DoctorID Doctor ID N/A LastName Last Name 25 FirstName First Name 20 OfficeNumber Office 3 PrimarySpecialty Specialty 30 MoveInDate Tenant Since N/A Save the table after updating the properties. Enter the data records shown in Table 1-18 into the Physicians table. Remember that the DoctorID field is automatically entered by Access. Table 1-18 This table lists the data values to be typed in each of the fields in the Physicians table. It contains data for four doctors. Last Name First Name Office Number Specialty Move-In Date Agarwal Ashish 101 Pediatrics 2/15/2018 Scher Elizabeth 115 Cardiovascular Disease 4/1/2020 Sharma Rajni 101 Pediatrics 11/8/2020 Foster Margaret 200 Cardiovascular Disease 7/1/2011 Save and close the Physicians table. Import the remaining data records from Excel into the Physicians table. Launch the Get External Data – Excel Spreadsheet dialog box. Locate and select the PhysiciansDataFile-01 Excel file. Append the records to the Physicians table. Launch the Import Spreadsheet Wizard. Finish the Import Spreadsheet Wizard. Close the Wizard after the records have imported. Open the Physicians table in Datasheet view. Your table should contain 16 records. Change the layout of the Physicians table. Change the Font Size to 12. Use AutoFit to increase the column width of the Specialty field. Use AutoFit to increase the column width of the Tenant Since field. Center-align the Doctor ID, Office, and Tenant Since fields. Change the Alternate Row Color to Blue, Accent 1, Lighter 60% (fifth column, third row in the Theme Colors category). Save the changes to the layout. Sort the Physicians table in ascending order by the Specialty field. Remove the sort criteria. Filter the Physicians table to find the doctors who moved in on or after 1/1/2017 and who have a specialty in Pediatrics. The table should look similar to Figure 1-121. Datasheet view of Physicians table displays three records. Figure 1-121 Records filtered on Specialty and Tenant Since Clear all the filters. The datasheet updates to show all the records. Close the Physicians table. Do not save any of the changes as a result of sorting or filtering the table. Add the following database properties. Title: Courtyard Medical Plaza Physicians Author: Caroline Rios Company: CMP Click OK to save the changes. Close the database. Upload and save your project file. Submit project for grading. #MicrosoftAccess #Access #IndependentProject1-459 views