

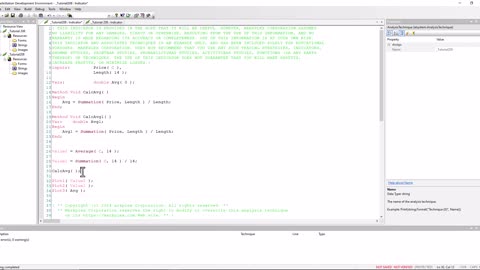
Tutorial 208 | Why use Methods?
Markplex subscriber asked what were the advantages in using methods in EasyLanguage. What is the point of them and are they really necessary? This tutorial will attempt to answer these question and gives various examples of simple methods.
https://markplex.com/free-tutorials/tutorial-208-why-use-methods/
2
views
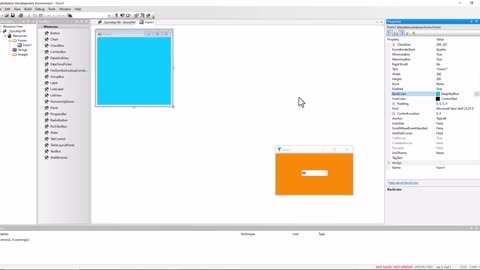
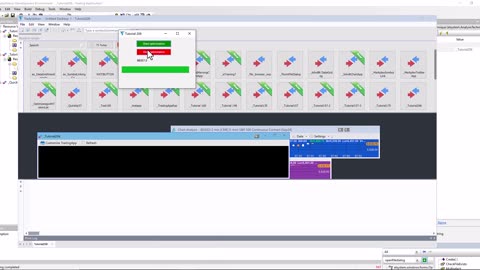
Quick-tip 100 | Moving a drawing object using the NumericUpDown control
Quick-tip 100 demonstrates a simple form that displays a bar number within a NumericUpDown control. A drawing object, in this example, a short horizontal trendline drawn across 4 bars at the low of the most recent bar, is positioned on the current bar number. By clicking the up/down control, the trendline is moved. As new bars are added to the chart the line can be repositioned on the new bars. The value can also be typed into the control.
https://markplex.com/free-tutorials/tradestation-easylanguage-quicktips/quick-tip-100-moving-a-drawing-object-using-the-numericupdown-control/
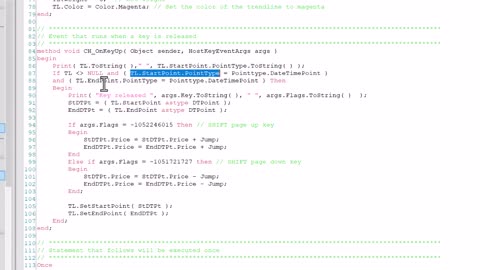
Quick-tip 99 | Moving trendlines using the SHIFT/PgUp PgDn keys
A Gold Pass member asked how it would be possible to manually draw trend lines on the chart and then move them a certain distance parallel to their original position, either up or down.
The quick-tip tutorial demonstrates how to detect a new trendline has been drawn. This trendline can be shifted up or down by the user input Jump amount by pressing SHIFT-PgUp or SHIFT-PgDn respectively. The program also changes the color and thickness of the trendline when it is drawn.
2
views

Tutorial 200 | Saving drawing object information in CSV files
Tutorial 200 explains how to store details of rectangles drawn on a chart in a CSV file using a StreamWriter. When new rectangles are drawn, the program recognizes the fact and adds them to the CSV file.
See more details here: https://markplex.com/free-tutorials/tutorial-200-saving-rectangle-information-in-csv-files/

QuickTip 95 | Drawing a rectangle between two times and prices
Quick-tip 95 explains how to draw a rectangle on a chart between two times. In the first part of the tutorial I demonstrate simple syntax to draw a rectangle. I also explain a couple of potential problems. In the second part of the tutorial I explain how these problems may be resolved.
The quick-tip also explains how to convert dates and time to DateTime format and how to created DateTime points.

QuickTip 94 | Drawing a vertical line on the last bar of the chart
_Quicktip94 is a TradeStation EasyLanguage quicktip from markplex.com that demonstrates how to draw a vertical line on the last bar of the chart. The quicktip positions the line using a BNPoint. In the BNPoint creation, the bar number is adjusted by adding MaxBarsBack and subtracting 1. The color of the line is set to dark orange and showdate set to true. The default persist property for vertical lines is false, it is set to true so that it doesn't disappear the on the tick following it being added.
As each new bar is formed, the vertical line is moved to the new bar.
See https://markplex.com/free-tutorials/tradestation-easylanguage-quicktips/quicktip-94-drawing-a-vertical-line-on-the-last-bar-of-the-chart/
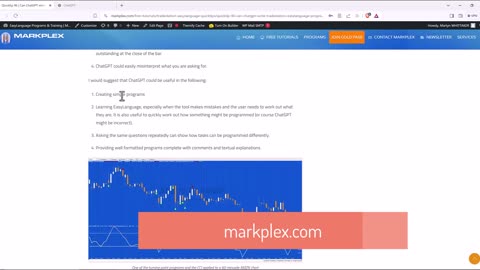
Quicktip 96 | Can ChatGPT write TradeStation EasyLanguage programs?
But can ChatGPT write simple TradeStation EasyLanguage code?
I asked it three questions and received the scripts described in the video. The questions were:
Write TradeStation EasyLanguage indicator using a Vector object (NOT an array) to calculate and plot the CCI on a chart
Write TradeStation EasyLanguage Show me study to show significant turning points in price based on momentum and volume
Write TradeStation EasyLanguage Show me study to show significant turning points in price based on momentum, stochastics and volume
2
views

Tutorial 205 Part 2 | Converting tutorial 173 to a function
This tutorial demonstrates how to convert tutorial 173 into a function, and how to call the function.
Tutorial 205 | How to convert tutorial 23 (line break) and tutorial 173 (supertrend) into functions
Tutorial 205 demonstrates how to convert tutorial 23 (line break) (https://markplex.com/free-tutorials/tutorial-23-creating-3-line-break-3lb-indicator-apply-normal-candlestick-charts/) and tutorial 173 (Markplex supertrend) (https://markplex.com/free-tutorials/tutorial-173-markplex-supertrend/) into functions.
Tutorial 206 | Using the OpenFileDialog class to access a text file for use with optimization class
Based on Tutorial 100 (see https://markplex.com/free-tutorials/t...) and Quicktip 37 (see https://markplex.com/free-tutorials/t...
Tutorial 100 demonstrated a simple optimization using the optimizer class. Quicktip 37 took the tutorial 100 program, which had a list of symbols to be used in the optimization 'hard coded' into the program, and instead made it so that the user to store the list of symbols into a txt file and for the program to import.
Tutorial 206 extends this further by taking the Quicktip 37 program and allowing the user to search for a file on their hard drive. The file is selected and the symbol data is imported.
#EasyLanguage #tradestation #markplex


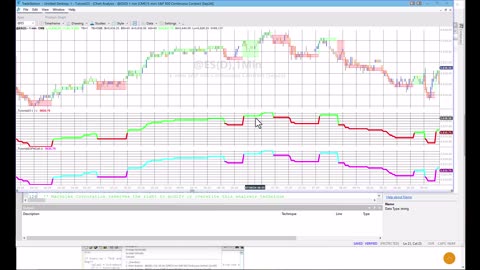
Tutorial 204 | Looking for conditions to occur within specified numbers of bars of each other
A Gold Pass asked for a tutorial about how to write a program that looked for three conditions to occur, in order. The first condition should occur, then the second condition should occur within a specified number of bars of the first. Finally a third condition would occur within a certain number of bars of the second.
The occurances being looked for in this show me study are a moving average cross over, a doji and and Bullish Harami. There was no particular logic in picking these specific conditions merely just a way of demonstrating this technique.
In this example the program looks for the moving average cross over. When it found it then looks for a Doji for the next 5 bars. If the Doji is found the program then looks for a Bullish Harami with the next 24 bars. The show me plots every time one of the conditions is found, a green dot for the average cross-over, a blue dot for a Doji and a red dot for a Bullish Harami.
In the strategy version a market order is made when the three conditions have occurred.
The way the program works is by using counters that continually increment. When one of the conditions occurs, the counter for that condition is reset to zero.
Note that the initial values for the counters are set to a level where a condition is erroneously recorded.
It is useful to create a show me study prior to a strategy to ensure that the program is working as anticipated.
See https://markplex.com/free-tutorials/tutorial-204-looking-for-conditions-to-occur-within-specified-numbers-of-bars-for-each-other/
1
view

Tutorial 203 | Calculate Volume Ratio in RadarScreen
A Gold Pass member asked how it would be possible to display the Volume Ratio on RadarScreen. As you may know the standard indicator (Volume Ratio) is not available for RadarScreen because it uses the following code:
TotalTicks = UpTicks + DownTicks;
If TotalTicks > 0 then VolRatio = 100 * ( UpTicks - DownTicks ) / TotalTicks
else VolRatio = 0;
VolRatioAvg = XAverage( VolRatio, AvgLength );
and UpTicks and DownTicks return zero in RadarScreen.
Tutorial 203 demonstrates a couple of ways that volume ratio can be displayed in RadarScreen.
The first way uses a program applied to a chart which calculates the Volume Ratio and then uses the Global Dictionary to share the data with a receiving program applied to RadarScreen.
The second way uses a Price Series Provider to calculate Volume Ratio within RadarScreen.
See https://markplex.com/free-tutorials/tutorial-203-calculate-volume-ratio-in-radarscreen/
1
view
Quick-tip 93 | Navigating around Markplex.com
Quick tip 93 talks about the markplex.com website and how you can find specific information.
I’m often asked questions, for example: ‘do you have anything about CCI or about stochastic’ or about some other issue. There’s a very good way of finding that out on the website.
If you go to the homepage, on the right hand side you’ll see the magnifying glass. So, for example, if we were interested in CCI you’d just type in CCI (not touching the return key or the enter key). And you’ll see now we’ve got a list of all the programs, tutorials, quick tips and ‘question and answers’ on the specific topic being searched for. You can then go click on any of the links to take you to the relevant page.
Now if we went further having typed in the search query, then if we press the enter key you will see is a little bit more detail on each of those resources. Note that the Question and Answer or ‘Q&A’ pages are only visible to Gold Pass members.
See https://markplex.com/free-tutorials/tradestation-easylanguage-quicktips/quick-tip-93-navigating-around-markplex-com/
QuickTip 94 | Drawing a vertical line on the last bar of the chart
_Quicktip94 is a TradeStation EasyLanguage quicktip from markplex.com that demonstrates how to draw a vertical line on the last bar of the chart. The quicktip positions the line using a BNPoint. In the BNPoint creation, the bar number is adjusted by adding MaxBarsBack and subtracting 1. The color of the line is set to dark orange and showdate set to true. The default persist property for vertical lines is false, it is set to true so that it doesn’t disappear the on the tick following it being added.
As each new bar is formed, the vertical line is moved to the new bar.
See https://markplex.com/free-tutorials/tradestation-easylanguage-quicktips/quicktip-94-drawing-a-vertical-line-on-the-last-bar-of-the-chart/
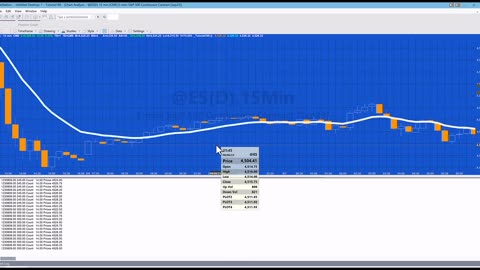
Tutorial 202 | Calculate price to reach a user input RSI value
Tutorial 202 seeks to look at the RSI calculation and calculate what price (this bar) needs to be for the RSI to reach (or go down to) a specific value.
To achieve this the calculations the RSI calculations are solved for Price (i.e. price this bar). Because the above formula includes AbsValue, we actually solve for two eventualities (i.e when price is greater than price last bar and when price last bar is greater than price this bar).
See https://markplex.com/free-tutorials/tutorial-202-calculate-price-to-reach-a-user-input-rsi-value/
4
views
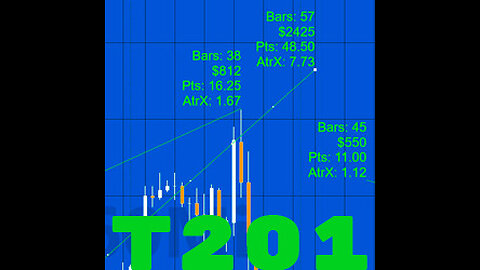
Tutorial 201 | Annotated trend line drawing tool
In tutorial 201 trendlines drawn on the chart are are analyzed and text is added to the chart, associated with the trendline. The contents of the text can include, either points value, dollar value, ATR multiple (before the trendline), number of bars or a combination of all this information depending on the setting of a user input: ShowValue.
The ATR value being shown is actually the multiples of ATR (calculated before the move) for the move, not the ATR value.
If the chart is refreshed the program recalculates the values based on the trendline objects that remain on the chart. This also occurs if MaxBarsBack is set to auto-detect. In this case, when a drawing object is added earlier on the chart to the current drawing objects, the chart recalculates.
If the lines are moved or either of the start or end positions are changed, the text label is updated.
The free download is available here: https://markplex.com/free-tutorials/tutorial-201-trend-line-drawing-tool/
Remember to subscribe to the Markplex email list at https://markplex.com
1
view

Quick-tip 89 | Importing a text file into ELCollections
Collections for EasyLanguage is a versatile and powerful programming feature that allows TradeStation EasyLanguage to manage and manipulate groups of data efficiently.
_Quick-tip 89 explains how to import a comma delimited text file into an ELCollections collection of lists. In this example the lists include list of numbers and lists of strings. The quick-tip also demonstrates ways of accessing the data once the text file has been imported.
See https://markplex.com/free-tutorials/tradestation-easylanguage-quicktips/quick-tip-89-importing-a-text-file-into-elcollections/
3
views
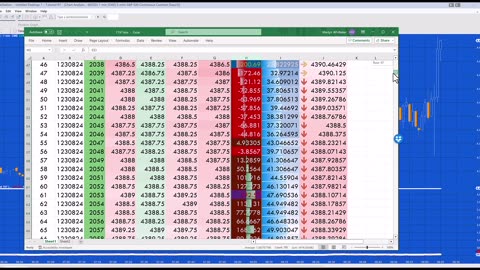
Tutorial 197 | Storing bar and analysis technique data in Excel
A Gold Pass member asked how to create an Excel spreadsheet with n rows and m columns, the n rows representing each of the successive bars on an intraday chart, and for each of the n rows a column for each of the m different indicator values that appear on that bar. In tutorial 197 the following data is stored for each successive bar: a bar counter, date , time, close, open, high, low, the value of the calculated CCI, the values of the calculated RSI and the average of the closing price. The values for the most recent bar are updated in real time.
When the program is restarted it reopens and rewrites the data.
The tutorial also touched upon the use of the Microsoft Excel "Conditional Formatting" feature.
Other Excel integration tutorials include:
Tutorial 150 | Sharing data between two charts using Microsoft Excel
Tutorial 113 | Using data from an Excel sheet to update an EasyLanguage program
Tutorial 112 | Transfer price data from a Price Series Provider applied to a chart to an Excel spreadsheet
Tutorial 96 | Using the Workbook component to share information with Excel
15
views
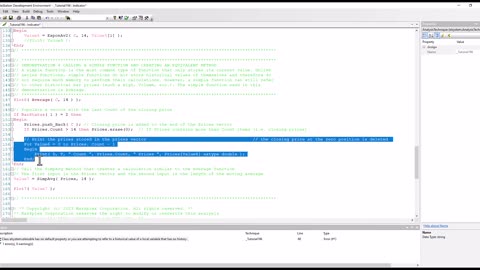
EasyLanguage Tutorial 196 | Scope in methods (plus convert a function to a method) | Part 2
Tutorial 196 gives an example of “scope” in the context of a method.
A common guideline in good programming practice suggests that a method should ideally only utilize variables that are provided through its parameter list or those that are locally declared within the method itself. However, there are situations where adhering strictly to this principle might be overly cumbersome or impractical. In such cases, it becomes possible to reference variables that have been declared at a the EasyLanguage study level.
Both “types” of methods are demonstrated in this tutorial.
When a variable is declared within the primary section of a study, it can be directly accessed and modified throughout that study. Nevertheless, when a method is invoked, it operates within its designated scope by design. This means that a variable declared within a method is confined to that method’s scope. Even if a variable with an identical name exists elsewhere, it is treated as a distinct and separate entity, maintaining its own distinct scope within the method.
To demonstrate converting the functions to methods two functions are used:
XAverage (a series function), and
Average( a simple function)
See https://markplex.com/free-tutorials/tutorial-196-scope-in-methods-plus-convert-a-function-to-a-method/
EasyLanguage Tutorial 196 | Scope in methods (plus convert a function to a method) | Part 1
Tutorial 196 gives an example of “scope” in the context of a method.
A common guideline in good programming practice suggests that a method should ideally only utilize variables that are provided through its parameter list or those that are locally declared within the method itself. However, there are situations where adhering strictly to this principle might be overly cumbersome or impractical. In such cases, it becomes possible to reference variables that have been declared at a the EasyLanguage study level.
Both “types” of methods are demonstrated in this tutorial.
When a variable is declared within the primary section of a study, it can be directly accessed and modified throughout that study. Nevertheless, when a method is invoked, it operates within its designated scope by design. This means that a variable declared within a method is confined to that method’s scope. Even if a variable with an identical name exists elsewhere, it is treated as a distinct and separate entity, maintaining its own distinct scope within the method.
To demonstrate converting the functions to methods two functions are used:
XAverage (a series function), and
Average( a simple function)
See https://markplex.com/free-tutorials/tutorial-196-scope-in-methods-plus-convert-a-function-to-a-method/
3
views
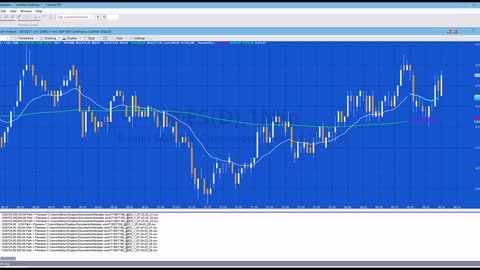
Tutorial 195 | Storing data in multiple new CSV files created by the program
There are many reasons why you might want a TradeStation EasyLanguage program to print data to an external file on your computer.
Tutorial 195 demonstrates how a program can create multiple files on a local computer and store data in each of them.
In this example program, applied to a 1 minute chart, exponential moving averages are calculated and then written to a CSV (Comma Separated Value) file. Every time a new hour begins, a new file is created. The files are named using a combination of the symbol name, the bar interval, the date and the hour, for example: “T195_@ES_1_07-16-23_19.csv.”
The files are created and the data stored using StreamWriter functionality and the data is available to be analyzed in a spreadsheet program.
https://markplex.com/free-tutorials/tutorial-195-storing-data-in-new-files-created-by-the-program/
15
views

Quick-tip 88 | DateTime behavior | TradeStation EasyLanguage tutorials and programs
Quick-tip 88 demonstrates a behavior of the TradeStation DateTime object. In particular it looks at how you could save the temporary value of a DateTime object into another DateTime object using the Value property.
See https://markplex.com/free-tutorials/tradestation-easylanguage-quicktips/quick-tip-88-save-a-datetime-object-into-another-datetime-object/
19
views
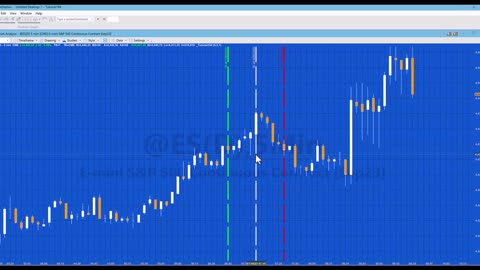
Tutorial 194 | Drawing vertical lines to left and right of a clicked bar
A Gold Pass Member asked how he would go about drawing vertical lines, 26 bars left and 26 bars right from a bar chosen by a mouse click.
Such an analysis technique needs three elements:
1) To be able to detect when a bar is clicked on the chart
2) To clear vertical lines drawn when a previous bar was clicked
3) To create and draw vertical line drawing objects
In this tutorial, rather than hard-coding the number of bars before and after the bar clicked, the number is determined by a user input (Gap) as are the weight and thickness of the vertical lines.
The colors of the lines are hard-coded but could easily be changed (see the tutorial video).
Technical lessons include:
Using the ChartingHost class to determine when a bar is clicked
Creating BNPoints for the bars where we draw Vertical lines
Clearing and adding VerticalLines to the chart
Modifying the weight and style of the vertical lines
See: https://markplex.com/free-tutorials/tutorial-194-drawing-vertical-lines-to-left-and-right-of-a-clicked-bar/
7
views
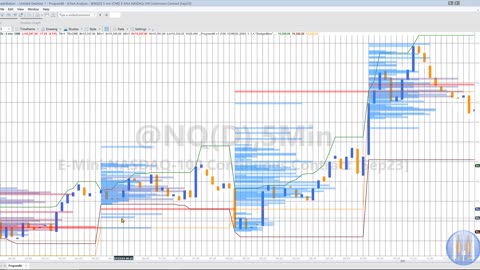
Program 86 | Recurring Volume Profile for a User Specified Time Period
See: https://markplex.com/easylanguage-programs/program-86-recurring-volume-profile-for-a-user-specified-time-period/
Program 86 uses thePrice Series Providerclass to create a volume profile for specified periods during the day. The length of this period is determined by a user input:RepeatTime. When this time elapses the volume profile is calculated and drawn. Data collection then starts for the next recurring period. This is repeated throughout the day. The profile is color coded between two user specified colors:HistColor1andHistColor2.
Having calculated the volume profile, Program 86 then calculates at which price level most volume occurred during the period being analyzed.
It also plots three horizontal lines at the following levels:
The price high of the period being analyzed
The price low of the period being analyzed
The price at which the highest volume occurred during the PREVIOUS period analyzed
Program 86 was designed and tested with TradeStation 10. It works on intraday minute bars.
The RepeatTime input determines both the time period over which the analysis takes place and when the analysis is repeated. For example, if 5 minute bars were used and the StartTime set to 1000, and RepeatTime set to 60 then the initial period analyzed would be the first tick after 1000 to 1100. The analysis would then be automatically repeated for the first tick after 1100 to 1200,first tick after1200 to 1300 etc.
This program will not work in MultiCharts because it uses the TradeStation collections and other functionality that is not available in the MultiCharts environment.
2
views