


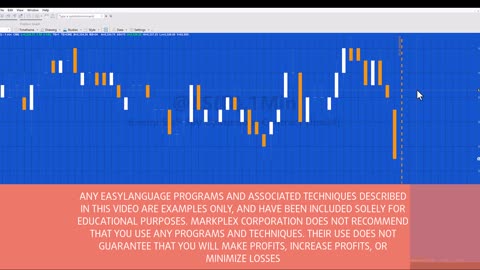
QuickTip 94 | Drawing a vertical line on the last bar of the chart
_Quicktip94 is a TradeStation EasyLanguage quicktip from markplex.com that demonstrates how to draw a vertical line on the last bar of the chart. The quicktip positions the line using a BNPoint. In the BNPoint creation, the bar number is adjusted by adding MaxBarsBack and subtracting 1. The color of the line is set to dark orange and showdate set to true. The default persist property for vertical lines is false, it is set to true so that it doesn't disappear the on the tick following it being added.
As each new bar is formed, the vertical line is moved to the new bar.
See https://markplex.com/free-tutorials/tradestation-easylanguage-quicktips/quicktip-94-drawing-a-vertical-line-on-the-last-bar-of-the-chart/

Tutorial 205 Part 2 | Converting tutorial 173 to a function
This tutorial demonstrates how to convert tutorial 173 into a function, and how to call the function.
Quick-tip 93 | Navigating around Markplex.com
Quick tip 93 talks about the markplex.com website and how you can find specific information.
I’m often asked questions, for example: ‘do you have anything about CCI or about stochastic’ or about some other issue. There’s a very good way of finding that out on the website.
If you go to the homepage, on the right hand side you’ll see the magnifying glass. So, for example, if we were interested in CCI you’d just type in CCI (not touching the return key or the enter key). And you’ll see now we’ve got a list of all the programs, tutorials, quick tips and ‘question and answers’ on the specific topic being searched for. You can then go click on any of the links to take you to the relevant page.
Now if we went further having typed in the search query, then if we press the enter key you will see is a little bit more detail on each of those resources. Note that the Question and Answer or ‘Q&A’ pages are only visible to Gold Pass members.
See https://markplex.com/free-tutorials/tradestation-easylanguage-quicktips/quick-tip-93-navigating-around-markplex-com/
QuickTip 94 | Drawing a vertical line on the last bar of the chart
_Quicktip94 is a TradeStation EasyLanguage quicktip from markplex.com that demonstrates how to draw a vertical line on the last bar of the chart. The quicktip positions the line using a BNPoint. In the BNPoint creation, the bar number is adjusted by adding MaxBarsBack and subtracting 1. The color of the line is set to dark orange and showdate set to true. The default persist property for vertical lines is false, it is set to true so that it doesn’t disappear the on the tick following it being added.
As each new bar is formed, the vertical line is moved to the new bar.
See https://markplex.com/free-tutorials/tradestation-easylanguage-quicktips/quicktip-94-drawing-a-vertical-line-on-the-last-bar-of-the-chart/
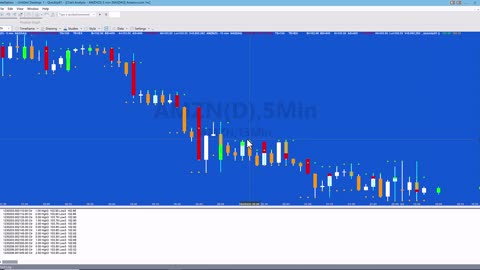
TradeStation EasyLanguage quick-tip 81
TradeStation EasyLanguage Quick-tip 81 shows how to find and plot the high and low of the last three 5 minute bars, every three bars. The quick-tip also mentions the need to adjust the number of 5 minute bars if you want to have it lining up with 15 minute bars.
https://markplex.com/free-tutorials/tradestation-easylanguage-quicktips/quick-tip-81-find-and-plot-the-high-low-of-last-3-5-minute-bars/
9
views
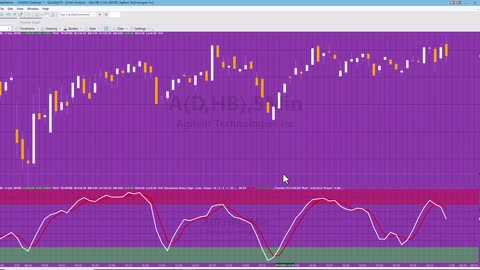
EasyLanguage Quick-tip 79 | How to use tutorial 114 to draw stochastic zones
TradeStation EasyLanguage Quick-tip 79 shows how to set up a chart using the tutorial 114 program to create colored bands on a standard stochastics indicator.
See https://markplex.com/free-tutorials/tradestation-easylanguage-quicktips/quick-tip-79-how-to-use-tutorial-114-to-draw-stochastic-zones/
3
views

TradeStation EasyLanguage tutorial 188 | Volume profile for user selected bars
Tutorial 188 is a new TradeStation EasyLanguage tutorial from Markplex that demonstrates how to select a number of bars using the drawing tool. It then paints the bars selected and analyzes and draws the volume profile.
https://markplex.com/free-tutorials/tutorial-188-volume-profile-for-user-selected-bars/
8
views

Quick-tip 77 | Printing programs and avoiding unwanted word-wrap
You may have noticed that when you print a program you sometimes get long lines of code split into multiple lines in order to fit on the paper (depending on the font size you use and the size of paper etc). This can make the program difficult to read.
This quick-tip demonstrates how to print a program to a PDF file while avoiding word-wraps (depending on the size of the line of code being printed.)
The quick-tip uses software from https://www.cutepdf.com/index.htm.
https://markplex.com/free-tutorials/tradestation-easylanguage-quicktips/quicktip-77-printing-a-pdf-of-a-program-without-word-wrap/
1
view
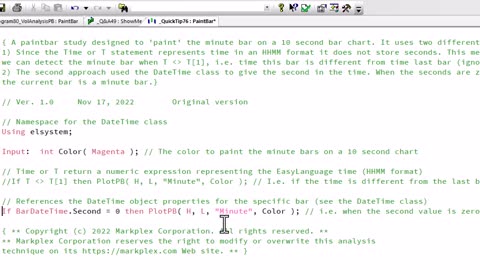
QuickTip 76 | Painting the minute bar on a 10 second bar chart | TradeStation EasyLanguage
QuickTip 76 is a paintbar study designed to 'paint' the minute bar on a 10 second bar chart. It uses two different approaches:
1) Since the Time or T statement represents time in an HHMM format it does not store seconds. This means that we can detect the minute bar when T Not Equal toT[1], i.e. time this bar is different from time last bar (ignoring seconds).
2) The second approach used the DateTime class to give the second in the time. When the seconds are zero it means that the current bar is a minute bar.
https://markplex.com/free-tutorials/tradestation-easylanguage-quicktips/quicktip-76-painting-the-minute-bar-on-a-10-second-chart/
1
view

QuickTip 74 | Finding the highest pivot on a chart | TradeStation EasyLanguage tutorials
Quicktip 74 demonstrates a TradeStation EasyLanguage show-me study that finds the highest pivot on a chart. The quicktip analyses each bar to check whether it is a high pivot and then checks whether this newly found pivot price is higher than the highest pivot price found so far. This value is plotted each bar.
Quicktip 74 is related to tutorial 182 except that it looks for highest pivot on the chart. Tutorial 182 calculates the pivot with the highest value WITHIN a user input number of bars of the current bar (user input: LookbackBars). (N.B. This is different from finding the highest pivot value on the chart.) Each time a pivot is found it is plotted. In tutorial 182 the bar number and the price level are stored in a dictionary.
For more information about this quick-tip see: https://markplex.com/free-tutorials/tradestation-easylanguage-quicktips/quicktip-74-finding-the-highest-pivot-on-a-chart/
For more information about tutorial 182 see: https://markplex.com/tutorial-182-highest-pivot-within-user-input-number-of-bars/
20
views
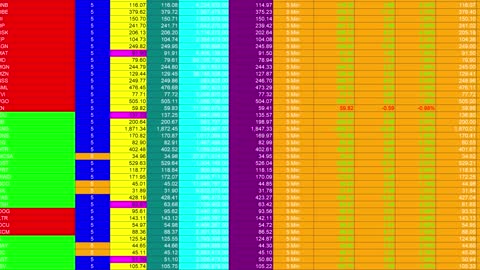
Tutorial 183 | Controlling background color in RadarScreen | TradeStation EasyLanguage tutorials
It is not possible to change the background color of a RadarScreen cell in the symbol column using TradeStation EasyLanguage. The background color of this column can be set as a property of the RadarScreen settings page but not programmatically.
But what if you needed more control over the plot colors, for example, to provide a visual alert? Tutorial 183 demonstrates a way of achieving this by replotting information and then using the SetPlotBGColor keyword to change the background color.
Tutorial 183 demonstrates how to:
1. Change the color of a complete column
2. Change the color of specific cells based on the symbol name or a value
3. Make cells flash on and off
4. Change the color of cells when they are clicked
The tutorial uses the quotes provider, the timer and the RadarScreen host provider (as well as TradeStation RadarScreen).
See https://markplex.com/free-tutorials/tutorial-183-controlling-background-color-in-radarscreen-tradestation-easylanguage-tutorials/
5
views
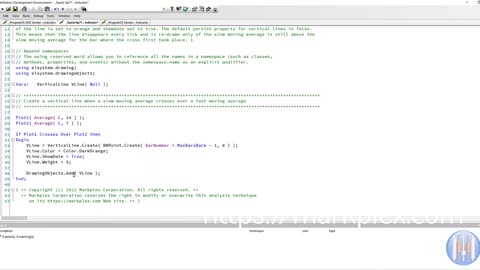
TradeStation QuickTip 71 Drawing a vertical line when there is a moving average crossover
_Quicktip71 is a TradeStation EasyLanguage quicktip from markplex.com that demonstrates how to draw a vertical line every time a slow moving average crosses over a fast moving average. The quick-tip positions the line using a BNPoint. In the BNPoint creation, the bar number is adjusted by adding MaxBarsBack and subtracting 1. The color of the line is set to orange and showdate set to true.
The default persist property for vertical lines is false. This means that the line disappears every tick and is re-drawn only of the slow moving average is still above the slow moving average for the bar where the cross first took place.
See https://markplex.com/free-tutorials/tradestation-easylanguage-quicktips/quicktip-71-drawing-a-vertical-line-when-there-is-a-moving-average-crossover/
6
views
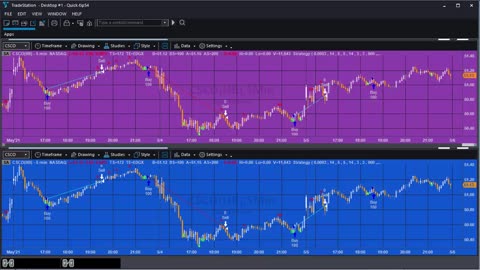
Quick-tip 54 | Modify tutorial 16 to use moving average rather than stochastics
Quick-tip 54 is TradeStation EasyLanguage tutorial that demonstrates a way of modifying tutorial 16 (https://markplex.com/free-tutorials/tutorial-16-tradestation-strategy-candlestick-patterns-stochastic-crossovers/) to use moving averages rather than stochastics.
Tutorial 16 looks for candlestick patterns, using the TradeStation standard functions, and if a certain stochastic pattern occurs enters or exits a trade. The program also uses the standard SetProfitTarget and SetProfitLoss functions.
Quick-tip 54 retains the stochastic functionality but also introduces an option to test for inequalities between 3 moving averages.
See https://markplex.com/free-tutorials/tradestation-easylanguage-quicktips/quick-tip-54-modify-tutorial-16-to-use-moving-average-rather-than-stochastics/
41
views