


4 in 5 pet parents claim their dog’s wellness is as important as their child’s
Nearly a third of dog owners claim they can immediately pick up on their pet’s different moods (28%), according to new research.
A survey of 2,000 dog owners found that after being around their furry friends for so long, pet parents know when their dog is happy when they wag their tail (28%), jump on them (24%) or show them affection with cuddles or kisses (23%).
Others said their pup loves being pet (21%) and has plenty of energy (20%) when they’re in a good mood.
Conducted by OnePoll on behalf of Ollie, the survey found that pet owners are used to their dog’s strange antics, like “trying to keep a neat environment,” “does a twirl when she’s begging for house food” and “sneezes for treats.”
A third of those polled would be concerned within a day or two if their pet started acting differently (31%).
Owners pay great attention to their dog’s behavior, as the average respondent gets worried they’ll lose their dog four times every year.
Four in five respondents who are also parents even said their dog’s wellness is just as important as their child’s (81%).
Pet parents know their dog is sad when they stop eating (24%), have low energy (23%) or whine or cry (22%).
The average pup has exhibited even stranger “abnormal behavior” five times over the past year. One pet owner said their dog was “constantly licking elbows,” while another said theirs “became lethargic and did not eat for a few days” and a third noticed their dog was “spinning around nonstop.”
Respondents keep a close eye on their furry friend’s behavior by keeping track with a journal or app (36%) and adjusting their diet to see if it’ll have an effect (31%).
“Your dog is uniquely yours; no one knows their quirks the way you do! This puts you, the pet parent, in an incomparable position to quickly identify changes in your pup’s normal behavior,” said Nicole Sumner, senior brand manager at Ollie. “These behavioral nuances could indicate something more serious.”
This prompts constant care for their pet’s wellness — even when it comes to sleeping. Respondents want to ensure their dog gets enough rest and do so by giving their dog a potty break before bed (39%), cuddle time before bed (37%) or a sleep supplement (34%).
Thirty-five percent even implement a bedtime/”lights out” time — by 9 p.m. for most dogs (69%).
Pet parents want to ensure their furry friend is rested enough to be active the next day, with a quarter of respondents saying they “always” take the time to be physical with their dog, no matter how tired they are from their day.
More than a third of owners also help their pup work up an appetite by exercising before meals (38%).
Caring for their canine carries over to mealtime where pet parents shared their tricks for getting their dog to eat like giving them a variety of foods (43%), having in-between snack times to keep them going throughout the day (43%) and stimulating their mind with puzzle feeder bowls (36%).
Owners see treat time as another way to care for their dog’s well-being by bonding and showing affection (50%), helping them manage stress or anxiety (46%) and boosting their nutrition (48%).
“Every dog is different, and every day contains slight deviations from the structure dogs crave,” Sumner said. “Dogs need a healthy mealtime and exercise routine to feel their best. We support pet parents and make it as easy as possible for them to give their dogs solid foundations for healthy lives.”
Survey methodology:
This random double-opt-in survey of 2,000 dog owners was commissioned by Ollie between Feb. 3 and Feb. 6, 2023. It was conducted by market research company OnePoll, whose team members are members of the Market Research Society and have corporate membership to the American Association for Public Opinion Research (AAPOR) and the European Society for Opinion and Marketing Research (ESOMAR).
30
views
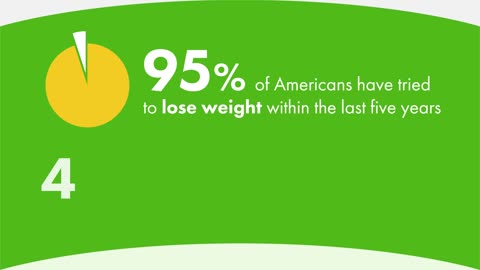
95% of Americans have tried to lose weight within the last 5 years
No, you’re not crazy and you’re not alone – losing weight continues to be a struggle for many Americans.
A poll of 2,000 Americans who have tried to lose weight at any point in their life found that 95% have tried to lose weight within the last five years. And 44% have struggled so much over the past half decade, that they’ve ended up gaining 21 pounds or more.
For the year ahead, 62% said they are planning to lose an average of 22 pounds to reach their goals. Over half (58%), however, recognize their weight loss goal is ambitious.
And though 72% said losing weight this year is a major priority for them, nearly as many (71%) believe there are a lot of challenges making it difficult for them to lose weight.
Commissioned by Nutrisystem and conducted by OnePoll, the study revealed the biggest challenges people face while trying to lose weight: maintaining willpower (28%), lack of motivation (27%), eating healthy foods (27%) and overcoming hunger (27%).
Other major challenges people said they face include the pure difficulty of losing weight (26%), the expense associated with weight loss (25%) and even finding time to work out (25%).
Many placed the blame on distractions in their lives — health issues (25%), money problems (23%) and social media (19%).
Even where people work was found to impact eating habits. Out of the 27% surveyed who said they work in a hybrid environment (half work-from-home, half in an office or on-location), 69% eat more frequently at home than they would otherwise do at their workplace.
“Losing weight may seem like a daunting task, but in reality, it doesn’t have to be,” said Courtney McCormick, corporate dietitian at Nutrisystem. “The best way to conquer your weight loss goals and overcome challenges is to find an affordable program that will help you every step of the way by providing things like real-time support, an intuitive app and meals that are portion-controlled, but protein-packed to help you stay fuller longer.”
The study also revealed 73% of Americans said losing weight is “great at first,” but then it slows down and plateaus. Similarly, 72% claimed it “feels like forever” before they see any weight loss results. Even then, the average person can only tell they’ve lose weight after 20 pounds.
The reasons why people choose to lose weight are more personal such as to improve their appearance (43%), feel more confident in themselves (39%) and to address major health concerns (39%).
When it comes to discussing their weight loss journey, 44% tend to keep the goal to themselves, while 40% don’t mind sharing their journey with others.
“Losing weight can come with its share of setbacks,” added McCormick, “But the best thing you can for your future self is make a commitment today to your present self. Weight loss is a journey, not a sprint. Aiming to lose a healthy 1-2 pounds per week will set you up for lasting success.”
TOP 10 WEIGHT LOSS CHALLENGES
-Maintaining willpower - 28%
-Lack of motivation - 27%
-Eating healthy foods - 27%
-Overcoming hunger - 27%
-The pure difficulty of losing weight - 26%
-The expense associated with weight loss - 25%
-Finding time to work out - 25%
-Not having access to a gym/exercise equipment - 25%
-The amount of time it takes - 23%
-Not having a support system - 22%
Survey methodology:
This random double-opt-in survey of 2,000 Americans aged 30 and above who have tried to lose weight in the last 5 years was commissioned by Nutrisystem between January 18 and January 23, 2023. It was conducted by market research company OnePoll, whose team members are members of the Market Research Society and have corporate membership to the American Association for Public Opinion Research (AAPOR) and the European Society for Opinion and Marketing Research (ESOMAR).
53
views

A study reveals people should upgrade from 'fast furniture' by age 28
By age 28, you should no longer have cheap furniture in your home, according to new research.
The survey of 2,000 general population Americans asked respondents about “fast furniture” — furniture that is inexpensive, mass-produced and designed to be quickly assembled and replaced.
Results revealed that over half of respondents (52%) currently own fast furniture, but 56% believe it’s only acceptable to have fast furniture until a certain age.
And respondents pinpointed just below the big three-oh as the age people should move away from fast furniture — with 47% admitting they’d even judge someone who had fast furniture in their home as an adult.
Commissioned by Avocado Green Mattress and conducted by OnePoll, the survey found many respondents naturally plan to move away from fast furniture.
Fifty-eight percent of respondents have purchased fast furniture as “starter” furniture, and 80% of those who have purchased fast furniture admit they didn’t expect it to last long.
On average, respondents think fast furniture has a two-year lifespan.
And when it’s time to upgrade, 65% said they’re more likely to throw fast furniture away, compared to other furniture, rather than spend time donating or selling it.
That’s even higher among those who currently own fast furniture — 83% admitted they’re more likely to throw their fast furniture away.
“Unfortunately, the medium density fiberboard and particle board commonly used in fast furniture often contain known carcinogens,” said Jessica Hann, Senior Vice President of Brand Marketing and Sustainability at Avocado Green Mattress. “Shoppers interested in safer, more sustainable options can look for furniture that’s approved by the Sustainable Furnishings Council.”
The survey looked beyond fast furniture, specifically, and also asked respondents about how sustainability plays into their decor choices.
Sixty-one percent consider themselves to be environmentally aware when it comes to their furniture and decor choices — and 79% of those who own fast furniture said the same.
But 38% of respondents also admit that fast furniture is less sustainable than “quality” furniture.
For some respondents who own fast furniture and still believe themselves to be environmentally aware, this contradiction may come from a stigma around shopping used.
Two-thirds of those surveyed (66%) would like to be more sustainable when it comes to the furniture in their home, but 58% said there’s a negative stigma around buying used furniture or picking up free furniture.
Some 56% of respondents would be more willing to buy used furniture if there was less of a taboo around thrift stores and picking up free furniture.
“Considering durability is one of the top three factors people consider when purchasing furniture, it’s no surprise that buying long-lasting, sustainable furniture is seen as a hallmark of adulthood,” said Hann. “No particleboard. No fiberboard. No toxic finishes or stains. Our furniture simply harnesses 100% solid, durable wood. We even have a Zero Waste Furniture line that harnesses upcycled wood scraps from our L.A. woodshop. Sustainability never looked so good.”
107
views

Can you eat soup in bed? New survey reveals Americans say that's a no-no
Two thirds of adults allow food to be eaten in bed – but soup, pasta and a stir fry are off limits.
A study of 2,000 Americans found 47% have eaten snacks or meals in their own bed, with 85% planning or hoping for breakfast in bed this Valentine’s Day.
But 34% simply do not allow food to be consumed under the covers, especially potentially messier foods like tacos, curry and ramen.
Despite differing opinions, those polled agreed fruit, chocolate and ice cream are acceptable to eat in bed.
If any meal should be eaten under the duvet, it’s breakfast, according to 52% and the likes of yogurt, toast and croissants appeared on the ‘allowed’ list of foods.
Commissioned by bakery brand St Pierre and conducted by OnePoll, the study found 52% admitted they can’t fully enjoy eating in bed because they’re too worried about the mess.
And while 26% believe it’s lazy, 44% argued food in bed is romantic.
“There is clearly a divide when it comes to the idea of eating in bed,” said St Pierre’s spokesperson. “While some will allow a greasy takeaway box or messy sauce covered meal in the boudoir, others understandably draw the line at anything other than breakfast.
“Having the first meal of the day in bed, especially with a partner, has for a long time been seen as a romantic gesture and many of us plan to start Valentine’s Day this year doing just that.”
The study also found it took smitten Americans an average of seven weeks together before taking their meals to the bedroom.
This Valentine’s Day, 69% plan to make breakfast in bed for a loved one, while 16% hope to be the recipient of it.
However, 72% have had to get rid of bedding as a result of food-related spillages and 49% have asked someone else to get out of their bed because they made crumbs.
Therefore, many rely on the likes of a napkin (70%), tray (63%) or towel (52%) to avoid mishaps.
Other situations in which people are most likely to eat in bed are when watching TV (66%), generally on weekends (54%) or if on a date (52%).
Almost half of those polled opted for lounging under the duvet if eating (47%), while 46% prefer to sit on top of it.
And 74% admitted they’re more laid back about eating in bed if it’s someone else’s rather than their own.
“Sharing food with a loved one is the perfect way to show you care, but our research suggests that such gestures can backfire, with 83% of Americans having been asked to get out of bed for making a food or drink faux pas!,” added the spokesperson. “That’s why we’re offering St Pierre NAPkins to diners, to keep the love alive and prevent any cross words over croissants this Valentine’s Day.”
“While breakfast is the most popular meal to be enjoyed in bed, one in five Americans are more likely to eat lunch or dinner under the covers.
“St Pierre products are perfect at any time of day, and since 63% of Americans currently own food-stained bedsheets, we’re giving 50 lucky winners the chance to win a St Pierre NAPkin, to protect their sheets and make future bedtime meals a little more magnifique.”
38
views

Nearly half of extroverts have a bigger sweet tooth in adulthood
Nearly two in five (37%) people say they have a bigger sweet tooth now than when they were a kid.
A recent survey of 2,000 U.S. adults split the respondent pool by introverts and extroverts and found that nearly half (49%) of extroverts claim their sweet tooth has grown since childhood.
More self-reported introverts than extroverts preferred chocolate desserts (46% vs. 31%) and were also more likely to eat sweets in the morning (33% vs. 15%).
And if you’re an introvert, chances are your parents “always” or “often” let you eat desserts as a child (71%).
That may be why introverts are more likely than extroverts to order from the dessert menu when eating out (61% vs. 50%).
Conducted by OnePoll on behalf of Nothing Bundt Cakes for the launch of their new OREO Cookies & Cream cake, the survey also discovered how optimists and pessimists differ in their dessert preferences.
Those with an optimistic viewpoint overwhelmingly preferred sweet over sour treats (77%), compared to 51% of pessimists. And if you tend to have a gloomy outlook, you’re more likely to go for a sour treat than someone with a sunny disposition (20% vs. 7%).
Furthermore, a positive outlook on life may indicate a greater propensity toward cake (46% vs. 29%). Overall, more than two in five (42%) say cake is their favorite dessert.
Most respondents developed a greater openness toward new desserts going into adulthood, with 73% eating sweets they never tried as a kid.
Additionally, the research looked into the social aspects surrounding desserts and found that 41% of those with a partner or spouse have a favorite dessert in common.
Seven in 10 (73%) said knowing someone’s favorite dessert indicates a certain closeness. To that end, nearly half (48%) would try a dessert they don’t usually like if offered one by a close friend, and the same amount said their pal would do the same.
Sharing is caring for 58% of respondents, who “always” or “often” share their desserts with someone else.
“Whether you save a slice for someone else or have it all for yourself, our research shows 42% say cake is their favorite dessert, indicating its timelessness,” said Nothing Bundt Cakes Chief Marketing Officer Angie Eckelkamp.
The average person polled eats about three desserts per week and has just as many different types of sweets at home.
“Cakes have long been a birthday staple, but we’ve seen cakes become the centerpiece for occasions year-round, as well as ‘just because’ or everyday treats. So, it makes sense to see cakes listed as the top vote-getter for desserts, no matter if you’re an introvert or extrovert,” she added. “And while classics like strawberry, chocolate and vanilla topped the list of respondents’ favorite flavors, we were excited to see cookies and cream also featured within the top 10.”
27
views

Having a cat in your dating profile makes you more attractive
Forget the “lonely cat lady” stereotype: a new poll suggests that when it comes to romance, cat owners are doing just fine, if not better.
In a recent comparison of 1,000 Americans who own cats and 1,000 who don’t, the survey found that marriage rates among both groups were essentially the same (79%).
What’s more, cat owners were actually slightly more likely to be involved in relationships (92% vs 89%) than non-cat owners.
And half of feline-deficient singletons claimed to be uninterested in dating to begin with, compared to only one in three cat fanciers.
Conducted by OnePoll for the brand World’s Best Cat Litter, survey results also revealed that 72% consider owning a pet to be “attractive,” regardless of their own relationship or pet ownership status.
When asked to imagine a scenario in which a potential online dating match is pictured with a cat, the majority of respondents said they’d be “more interested” as a result – including 75% of people with cats and 61% of people without.
Meanwhile, seven in 10 think you should have to disclose whether or not you own pets in your profile – same as the amount who think parents on dating apps should mention having kids.
“Even if you’re not the type to treat your pets like they’re your children, they’re still an important part of the family and can wield a lot of influence,” said Jean Broders, Director of Marketing for World’s Best Cat Litter. “Cat owners clearly seem to know this, as our findings indicate they’re more likely to worry about making a good first impression on a partner’s pet.”
Four in 10 have even gone home with a potential date specifically to meet that person’s pet, according to the data.
Even still, 40% of cat owners polled said they’d still be willing to date someone who didn’t like cats – although an “open hatred of cats” proved the top deal breaker among that same group.
Being allergic to cats is also a bigger issue than you might think – while not surprisingly, 41% of cat owners cited it as a problem, so did 32% of those without cats.
Interestingly, cat owners seemed slightly more willing to consider a romantic partner who didn’t have a job – only 34% described it as a deal breaker, compared to 40% of non-cat owners.
“Perhaps they figure there’ll be someone at home to do all the feeding and cleaning,” mused Broders. “After all, almost 77% said they worry that guests will be able to smell odors from their cat’s litter box, so it’s clearly a pressing concern!”
BIGGEST DEAL BREAKERS FOR CAT OWNERS
1. If they openly hated cats - 45%
2. If they were allergic to cats - 41%
3. If they lived more than an hour away from you - 37%
4. If they didn’t have a job - 34%
5. If they owned a dog - 34%
6. If they still lived with their parents - 27%
7. If they belonged to a different political party than you - 18%
8. If they didn’t own any books - 6%
9. If they were bad at spelling in their messages - 4%
10. None of these would be deal breakers - 11%
BIGGEST DEAL BREAKERS FOR EVERYONE ELSE:
1. If they didn’t have a job - 40%
2. If they lived more than an hour away from you - 38%
3. If they were allergic to cats - 32%
4. If they owned a dog - 31%
5. If they openly hated cats - 31%
6. If they still lived with their parents - 29%
7. If they belonged to a different political party than you - 21%
8. If they didn’t own any books - 9%
9. If they were bad at spelling in their messages - 9%
10. None of these would be deal breakers - 13%
Survey methodology:
This random double-opt-in survey of 1,000 cat owners and 1,000 non-cat owners was commissioned by World’s Best Cat Litter between Jan. 27 and Jan 31, 2023. It was conducted by market research company OnePoll, whose team members are members of the Market Research Society and have corporate membership to the American Association for Public Opinion Research (AAPOR) and the European Society for Opinion and Marketing Research (ESOMAR).
64
views

7 in 10 Americans believe apps will replace websites in the next decade
The average person believes websites will become obsolete in the next decade.
A recent survey of 2,000 U.S. adults discovered seven in 10 (70%) believe apps are gradually replacing websites.
With people relying on their phones for absolutely everything, it’s no surprise more than one in four (26%) think they can go a year without using a standard computer browser.
While 69% use their smartphone daily, only 44% report using their desktop or laptop with the same frequency.
Forty-six percent have even done a full day’s work entirely from their smartphone, and 42% have used it to file a tax return.
Conducted by OnePoll on behalf of Cricket Wireless for their Tax Time initiative, the survey also found that if forced to choose between a smartphone and a computer, 59% would opt for their phone.
Thirty-six percent think they could only go less than a day without their smartphone. iOS users proved to be rather resilient, with 34% claiming they can survive phoneless for a week compared to 21% of Android users.
While entertainment (67%) and communication (66%) apps rank among the most common, more respondents have a finance app on their smartphone (59%) than those who have news/magazine apps (28%).
“From work to play, our research shows people are embracing the convenience of apps in all areas of life,” said Tony Mokry, Vice President & Chief Marketing Officer for Cricket Wireless. “Apps can also be a great way to try out alternative services before committing.”
More than half of respondents (52%) rely on software or apps to file their taxes, compared to 36% who do them by hand.
Interestingly, only two in five (40%) anticipate getting a tax refund in 2023, with the average person expecting about $2,338.
Those expecting a refund plan to put it toward a mobile wallet (25%), deposit it in a traditional checking or savings account (25%) and add it to an investing app (23%).
“There are many ways to get the most out of your refund, such as by upgrading your phone and wireless provider simultaneously,” Mokry added.
THINGS PEOPLE HAVE DONE ENTIRELY ON THEIR SMARTPHONE
● Shopping for groceries - 51%
● Taking photos/videos for special events - 51%
● Shopping for clothes/accessories - 47%
● Completing a full day’s work - 46%
● Completing a tax return - 42%
● Completing a homework assignment - 39%
● Reading books/magazines - 38%
● Dictation/transcription - 22%
Survey methodology:
This random double-opt-in survey of 2,000 general population Americans was commissioned by Cricket Wireless between Jan. 20 and Jan. 23, 2023. It was conducted by market research company OnePoll, whose team members are members of the Market Research Society and have corporate membership to the American Association for Public Opinion Research (AAPOR) and the European Society for Opinion and Marketing Research (ESOMAR).
45
views

Expert says there’s a biological reason we’re obsessed with true crime shows
Watching true crime shows may help prepare you if you find yourself in a similar situation, according to an expert on morbid curiosity.
Coltan Scrivner, a research scientist at Recreational Fear Lab and an expert in morbid curiosity, feels there’s an almost primal reason people are endlessly fascinated by true crime content.
According to Scrivner, morbid curiosity about dangerous people likely began some 300,000 years ago when humans began using language and engaging in proactive aggression instead of reactive aggression.
“Now this presents a problem for people because with proactive aggression it’s hard to tell who is plotting to harm you,” says Scrivner. “So this put a selection pressure on our minds to learn to seek out information about people who are potentially dangerous.
“True crime can have a learning component to it or at least a perceived learning component. We feel like we’re more prepared in these kinds of situations. So if this dangerous situation were to occur, you feel a little more prepared and know what you should or shouldn’t do.”
This claim is supported by research data collected by OnePoll. The new survey of 2,000 self-reported true crime fans found that 76% feel that consuming content about true crime helps them avoid similar situations happening to them.
The average respondent consumes five true crime programs each month, with 75% saying they watch the latest program the instant it's released and 71% typically binge-watching the entire thing in one sitting.
The survey also found that 44% of respondents admit they have a “favorite” serial killer and 67% would like the opportunity to chat with one.
Over seven in ten of those polled (71%) also admit to feeling less trustworthy of other people due to how much true crime content they consume.
But can watching too much content about violent crime make one more likely to commit a violent crime? Scrivener doesn’t see a connection.
“So there are distinctions between becoming desensitized to seeing graphic content on your television and being OK with graphic content happening around you. A great example of this would be the research on violent video games over the course of the last 20 years,” continued Scrivner. “It was a huge deal because people were concerned that as video games became more realistic and as the violence became more realistic that it would cause kids, in particular, to become more violent.
“But the research is pretty clear at this point that playing violent video games doesn’t make kids more violent, I would be fairly sure that the same is true of something like true crime, where watching true crime doesn’t make you less empathetic towards the victims or more empathetic towards the killer or anything like that. It might have some psychological effects but it’s very unlikely that it would have any effects along those lines.”
Survey methodology:
This random double-opt-in survey of 2,000 American true crime fans was commissioned between December 16, 2022 and January 4, 2023. It was conducted by market research company OnePoll, whose team members are members of the Market Research Society and have corporate membership to the American Association for Public Opinion Research (AAPOR) and the European Society for Opinion and Marketing Research (ESOMAR).
71
views
How Americans rank their priorities for a balanced life this year
Just a third of Americans are satisfied with their wellness (34%), according to new research.
A survey of 2,000 U.S. adults 21 and older found that two in three think there’s at least some room for improvement when it comes to their wellness (67%).
Seventy percent said that caring for their well-being is a priority, and a similar percentage agree the same is true about wanting to live a “balanced life” and considering different aspects of their life like relationships, fitness and health (67%).
This year, Americans rank their priorities for a balanced lifestyle as being more conscious of what their body wants and needs (73%) or consuming alcohol in moderation (46%).
Others want to spend more time outdoors (45%) and develop routines to keep themselves on track (41%).
However, many understand that these goals don’t come without drastic changes to their current lifestyle (78%).
Conducted by OnePoll for Giesen Wines of New Zealand, the survey found that the secret to making lasting changes is employing mindful decisions which consider facets like thoughts and feelings that also fit with their lifestyle (49%).
Other beneficial factors for a successful wellness journey include having willpower (48%), perseverance (47%), consistency (42%) and support from others (33%).
Three in five respondents said they are likely to follow lifestyle trends (62%) and 38% are more likely to follow the lifestyle trends that go viral.
Similarly, 37% would keep an open mind to a trend that’s recommended by celebrities or trusted people in their life (31%).
Those surveyed also shared that following a new trend or fad may help bring some change to their life (47%) or help them to connect with others who share similar lifestyles (40%) and overall boost their happiness (38%).
In fact, 43% said they’ve followed trends in the past five years, especially around exercise (28%), food/dieting (26%) and mindful drinking (20%).
“Wellness comes in many forms, depending on what your goals are,” says Giesen Wines chief winemaker, Duncan Shouler. “Prioritizing your wellness is about making lifestyle choices that care for your mind and body. For instance, nearly half of those surveyed are interested in a change like “mindful drinking” (46%) — the practice of being aware of why and how much alcohol you drink — in 2023.
In 2022, the market for non-alcoholic wines and beverages grew by 7%, according to IWSR Drinks Market Analysis. We see this as being driven by rising consumer demand to seek a more balanced lifestyle through mindful drinking, particularly among younger audiences.”
Some of these have even made a lasting impact, with the average person turning four trends into long-term habits over the course of the past five years.
Respondents said the effort these changes take is worth it since it helps them feel organized (58%) and focused (56%) when they start making changes, then ultimately accomplished (56%) and motivated (54%) once they achieve their wellness goals.
Nearly half of those surveyed also shared they’d be interested in trying “mindful drinking” (46%) — the practice of being aware of why and how much alcohol you drink — in 2023.
Fifty-five percent of those who regularly consume alcohol are willing to commit to a “dry” timeframe this year — a period in refraining from drinking alcohol as a personal challenge, like “Dry January” or “Dry July” or “Sober October.” Of those who would consider non-alcoholic alternative options, respondents would opt for non-alcoholic wine (43%) above non-alcoholic beer (24%) or spirits (15%).
But mindful drinking changes don’t need to be so stark — even more respondents who drink alcohol would be interested in participating in a “damp” timeframe where they limit their alcohol intake rather than cut it out completely (69%) in order to meet their wellness goals (22%) or because others in their life are doing it (18%).
"Millions of consumers cut back on alcohol this January as part of a global wellness movement,” Shouler said. “Our number one consumer is an existing wine drinker seeking choices that best suit their lifestyle preferences, including periods of moderation or no-alcohol consumption. With our quality alcohol-removed wines, wine lovers realize an appealing option exists that has fewer calories and allows them to enjoy all the benefits of wine without the alcohol.
Survey methodology:
This random double-opt-in survey of 2,000 Americans 21+ was commissioned by Giesen Wines between Jan. 19 and Jan. 20, 2023. It was conducted by market research company OnePoll, whose team members are members of the Market Research Society and have corporate membership to the American Association for Public Opinion Research (AAPOR) and the European Society for Opinion and Marketing Research (ESOMAR).
55
views

Can you eat soup in bed? New survey reveals Americans say that's a no-no
Two thirds of adults allow food to be eaten in bed – but soup, pasta and a stir fry are off limits.
A study of 2,000 Americans found 47% have eaten snacks or meals in their own bed, with 85% planning or hoping for breakfast in bed this Valentine’s Day.
But 34% simply do not allow food to be consumed under the covers, especially potentially messier foods like tacos, curry and ramen.
Despite differing opinions, those polled agreed fruit, chocolate and ice cream are acceptable to eat in bed.
If any meal should be eaten under the duvet, it’s breakfast, according to 52% and the likes of yogurt, toast and croissants appeared on the ‘allowed’ list of foods.
Commissioned by bakery brand St Pierre and conducted by OnePoll, the study found 52% admitted they can’t fully enjoy eating in bed because they’re too worried about the mess.
And while 26% believe it’s lazy, 44% argued food in bed is romantic.
“There is clearly a divide when it comes to the idea of eating in bed,” said St Pierre’s spokesperson. “While some will allow a greasy takeaway box or messy sauce covered meal in the boudoir, others understandably draw the line at anything other than breakfast.
“Having the first meal of the day in bed, especially with a partner, has for a long time been seen as a romantic gesture and many of us plan to start Valentine’s Day this year doing just that.”
The study also found it took smitten Americans an average of seven weeks together before taking their meals to the bedroom.
This Valentine’s Day, 69% plan to make breakfast in bed for a loved one, while 16% hope to be the recipient of it.
However, 72% have had to get rid of bedding as a result of food related spillages and 49% have asked someone else to get out of their bed because they made crumbs.
Therefore, many rely on the likes of a napkin (70%), tray (63%) or towel (52%) to avoid mishaps.
Other situations in which people are most likely to eat in bed are when watching TV (66%), generally on weekends (54%) or if on a date (52%).
Almost half of those polled opted for lounging under the duvet if eating (47%), while 46% prefer to sit on top of it.
And 74% admitted they’re more laid back about eating in bed if it’s someone else’s rather than their own.
“Sharing food with a loved one is the perfect way to show you care, but our research suggests that such gestures can backfire, with 83% of Americans having been asked to get out of bed for making a food or drink faux pas!” added the spokesperson.
TOP 10 FOODS AMERICANS ALLOW TO BE EATEN IN BED:
Fruit
Chocolate
Yogurt
Ice cream
Pizza
Burger
Cake
Biscuits
Sandwich
Pie
TOP 10 FOODS AMERICANS BAN FROM BEING EATEN IN BED:
Soup
Pasta and sauce
Roast dinner
Stir fry
Curry
Fish and chips
Tacos
Ramen
Hot dog
Sausage and mashed potato
30
views

Pet owners average $1,100 spent during the first months of pet parenthood
New pet parents should be prepared to spend more than $500 in upfront costs when bringing home a new four-legged family member – and that’s just the start of the cost of pet parenthood.
A new survey of 2,000 pet owners revealed that respondents spent an average of $553 on things like adoption fees and food in preparation for their new pet.
On top of that, they spent another $550 on their pets within the first six months — resulting in 63% of respondents spending more than they planned to. Some 40% believe they spent more than other pet owners.
Items such as toys and beds (45%), grooming appointments (42%), different types of food (39%) and “puppy proofing” their home with items such as gates or covered trash cans (20%) racked up the bill during those first few months of pet ownership.
And while costs like vaccines (46%) and spaying or neutering (42%) may be expected, the average respondent had three unplanned medical expenses or vet visits within the first year of owning their pet.
Conducted by OnePoll on behalf of Healthy Paws Pet Insurance and Foundation, the survey showed the average respondent spent more than $1,100 in the first six months of pet parenthood — more than they’d be willing to spend on a vacation ($620.50).
In addition to preparation and routine medical care, respondents have more than $600 set aside in case of an emergency, but 46% worry it won’t be enough to cover it.
Based on experience, one in five have been faced with an emergency and fell short of the amount needed.
In order to get the pet the care they needed, many pet parents would travel any distance (42%), drain their bank account or savings (41%) and go into debt (38%).
Others would go even further and get a second job (41%) or even sell their car (35%).
“You don’t plan for your dog to swallow a plastic chew toy or your cat to develop diabetes. These are the types of conditions that can cost thousands in emergency or specialty veterinary care,” said Rob Jackson, CEO and chief pet protector at Healthy Paws Pet Insurance. “Enrolling your pet in insurance when they are young will help protect your wallet when these unforeseen events occur.”
More than a third (37%) of respondents got their pet from a breeder, but others came from a friend or family member (27%) or a shelter or rescue (24%).
Others unexpectedly welcomed their pet into their home — one in twenty found their four-legged friend on the side of the road or in their yard.
Almost three-quarters (73%) brought their pet home before their second birthday and they’ve had them for an average of four years.
However, a little more than one-third (37%) fall under the “pandemic pet” umbrella — bringing their pet home within the last two years.
The average respondent took about four months to decide they would get a pet.
In addition to finances (45%), pet parents considered their lifestyle, mental (43%) and physical (44%) health and their housing situation (48%) before bringing home a new pet.
Even so, one-quarter (25%) felt unprepared to bring their pet home.
If given the opportunity to redo preparing to bring their pet home, respondents would, “set aside more time for training” or “save more money.”
But at the end of the day, most respondents wouldn’t change anything. One respondent said, “I wouldn't redo anything. It was a learning experience, and it wasn't bad. Whatever I needed to do, I did. I wouldn't change it for the world. She is worth every penny I spent on her.”
“This survey makes it clear that people consider their pets family – to the point that they would get a second job or forgo a vacation to keep them healthy,” Jackson said. “Planning ahead by keeping up with routine care and purchasing pet insurance will ensure that people can enjoy their pets for their lifetime without going into debt or sacrificing other priorities.”
Survey methodology:
This random double-opt-in survey of 2,000 pet owners was commissioned by Healthy Paws Pet Insurance and Foundation between Dec. 19, 2022 and Jan. 2, 2023. It was conducted by market research company OnePoll, whose team are members of the Market Research Society and have corporate membership to the American Association for Public Opinion Research (AAPOR) and the European Society for Opinion and Marketing Research (ESOMAR).
22
views

Men consider themselves better money-savers than women
New research shows that one in five Americans would rate their ability to save money as “fair” or “poor.”
A survey of 2,000 employed men and women looked at the differences in how they save for the future and found that men are more likely than women to rate their money-saving abilities as higher than average (55% vs. 39%).
And, even though their confidence in their saving abilities varies, half also said they would take financial advice equally as seriously coming from a woman as a man.
Generally, people would be motivated to learn about their finances to secure their future (62%), maximize the value of the money they already have (60%) and not have to rely on someone else (54%).
Conducted by OnePoll for BOK Financial, the survey found that the average person started saving money at around 24 years old and learned how to best manage their finances from their parents as children (23%) and putting their skills to the test when they first started living on their own (22%).
And they’d advise others to start even earlier — from the first time they receive an allowance or monetary gifts as a child (32%) and once they have a job that produces income (24%).
However, only 21% of Americans said it’s a high priority for them to save money from each paycheck, with men making this a higher priority (59% vs. 44%).
Consequently, one in 11 respondents don’t feel financially secure for the future. Respondents estimate that 30% of their paycheck goes to bills and other required monthly expenses like rent or car insurance and half said their monthly expenses are even more costly than that (49%).
The average employed person claims to save about a quarter of their paycheck (26%), but more than one-third of respondents admitted they save less than this (36%).
Most Americans hold their savings in a savings account (66%) or checking account (54%), while the least popular options include certificates of deposit (CDs) (38%) or an investment account that holds stocks and bonds (32%).
“Which savings vehicle is right for you depends on your objective,” said Kimberly Bridges, director of financial planning at BOK Financial. “For example, for short-term goals, like putting money away for a down payment, a savings or money-market account might work best. A financial planner can sit down with you and offer suggestions based on your complete financial picture.”
Sixty-three percent of respondents have an “emergency fund” (a reserved amount of money to be used in times when regular income is disrupted or decreased), with men being more likely to have one (69% vs. 57%).
Those with an emergency fund estimate that they have about five months' worth of income there.
In the same vein, half of those surveyed have started saving for retirement (54%) in a company-provided account like a 401(k) or 403(b) (40%). And another 34% utilize an individual retirement account (IRA) to hold their savings.
The average person wants to retire at age 59, but 37% of respondents are aiming for even earlier.
Respondents shared that they want to retire before the 66-year-old standard because their “savings will be good enough,” they want to “be able to live a healthy life without working” and they feel they “should be enjoying what I have worked for.”
“The pandemic caused many people to weigh what they feel really matters in life,” Bridges said. “If you do decide that you want to retire early, it is possible but you need a concrete plan in place for how you will financially manage the rest of your life.”
Survey methodology:
This random double-opt-in survey of 1,000 employed men + 1,000 employed women was commissioned by BOK Financial between Jan. 3 and Jan. 9, 2023. It was conducted by market research company OnePoll, whose team members are members of the Market Research Society and have corporate membership to the American Association for Public Opinion Research (AAPOR) and the European Society for Opinion and Marketing Research (ESOMAR).
42
views

16 guests, 9 presents, 3 hours: Kids' birthday parties by the numbers
A new year of birthday planning is fast approaching — but some assembly may be required. The average kid’s birthday party involves 16 guests, nine presents and three hours of celebration.
A recent survey of 2,000 parents with kids ages 3–12 found 73% say their youngsters are not so easy to impress.
According to parents, kids expect their favorite foods (67%) and clowns or costumed characters (56%) for their birthday party, more so than inflatable playsets (44%) or laser tag (43%).
As for party themes, 81% of parents receive a specific request from their kids, with unicorns (46%) rising to the top, and video game-themed (41%) birthdays among kids’ popular picks.
Conducted by OnePoll on behalf of Kinder Joy for the launch of their new Birthday eggs, the survey also uncovered that the right guest list (58%), activities (58%) and treats (58%) are among parents’ absolute must-haves to make their kids’ birthday a success. Other essentials include goodie bags or party favors (49%).
Parents may catch a break when planning party games, though; it turns out freeze tag, charades, and treasure hunt have stood the test of time, with half of parents reporting their kids play these games on their birthday, and a similar amount saying they enjoyed these in their own childhood as well.
When asked to share one thing they had at their birthdays when they were growing up that they would like their kids to experience at parties today, respondents mentioned “board games,” “a DJ,” “a special speech,” “less technology,” and having “grandparents and extended family” attend.
At the end of the day, though, 78% of parents put a lot of pressure on themselves to make their kid’s birthday party as amazing as it can be.
Changing palettes may prove to be a challenge — 84% of parents reported that their kid has asked for different things at their birthday party at different ages, especially when it comes to food.
Party prep often goes beyond food and décor. More than two-thirds (68%) of parents usually create or hand out goodie bags for their child’s parties.
“With so many unpredictable factors, from the weather to unplanned guests, making your kid’s birthday memorable can be both fun and stressful,” said a spokesperson for Kinder Joy. “While kids’ tastes may change over the years, a well-stocked goodie bag is one party staple that is sure to be a hit regardless of age.”
Eight in 10 (82%) parents said kids’ birthday parties are a lot different now than when they were growing up. Namely, 61% think the celebrations and decor have gotten more over-the-top, and 55% noted the cake is usually store-bought rather than homemade.
Two things that probably haven’t changed? Needing more time to prepare for the birthday party and keeping it affordable, both of which stress out 55% of parents.
PARENTS’ STRESSORS WHEN PLANNING KIDS’ BIRTHDAY PARTIES
Having enough time to plan it - 55%
Keeping it affordable - 55%
Figuring out what foods to serve - 52%
Figuring out the guest list - 51%
Figuring out how much food to serve - 47%
Creating a party my kid will enjoy - 43%
Picking a theme - 37%
Not having enough help to plan/decorate - 31%
Finding a venue - 21%
Survey methodology:
This random double-opt-in survey of 2,000 parents of kids ages 3–12 who have birthday parties was commissioned by Kinder Joy between November 2 and November 9, 2022. It was conducted by market research company OnePoll, whose team members are members of the Market Research Society and have corporate membership to the American Association for Public Opinion Research (AAPOR) and the European Society for Opinion and Marketing Research (ESOMAR).
32
views

4 in 5 pet parents claim their pets are bigger sports fans than them
Is your pet a bigger sports fan than you? A new survey suggests that, yes, they probably are.
A poll of 2,000 American pet parents found that four in five claimed their pets to be bigger sports fans than them, out of the 68% who identified as sports fans themselves.
That’s probably because we’re bringing them to the viewing party: 79% said they watch sports with their pets and 83% even said their furry friends have a favorite sport to watch. Pets appear to be drawn to sports with a lot of action and running including football (40%), soccer (19%) and basketball (14%).
Commissioned by PetSmart and conducted by OnePoll, the study also revealed that 78% of pet parents think their pet has a favorite athlete, which may be why a majority of them (87%) have either named a pet after an athlete or would consider naming a pet after an athlete in the future.
Some respondents even shared their sports-inspired names: Lionel, Messi, Bolt, Fenway, Maholmes, Jackson, Hulk, Labron, Japhet and many more.
Pet sport-mania even goes into themed items. Two in three pet parents (65%) said they’ve bought their pet a sports team-themed item including pet bandanas (19%), collars (19%), jerseys (18%) and stuffed toys (17%) all sporting their favorite teams.
Of those who have bought sports team-themed clothing for their pets, 90% will dress their pet in the item when their team is playing.
For many, it pays off: 83% swear they’ve seen their favorite team win a game because their pet was present. A quarter (26%) said they watch sports with their pets because they’re actually a lucky charm.
“We know that pet parents will do anything for their pets, and there’s no question that pets are the real MVPs in our lives,” said Will Smith, senior vice president and chief marketing officer at PetSmart. “This new data not only reveals a pet’s excitement for sports, but it also highlights how we bring pets into all our favorite activities as they are a reflection of our own personalities and interests.”
The survey also found sports are just one type of show pets like to watch. Respondents shared their pets like to watch cartoons (45%), nature shows (41%), movies (41%) and comedy specials (37%).
How do pet parents know their pets are even watching what’s on the TV? The survey asked and found that after it gets turned on, pets react by staring at the screen (42%). And once they recognize something on-screen, they are likely to react by following the action with their eyes (54%), becoming vocal (52%) or perking their ears up (50%).
Overall, 69% of owners said their pets love watching shows with them.
21
views

More than 3 in 10 adults admit their parents pay for at least one bill
More than three in 10 (35%) adults admit they still have at least one bill on their parents’ tab.
According to a new poll of 2,000 Americans, the top three expenses still paid by parents are rent (19%), groceries (19%) and utilities (16%).
In fact, almost one-quarter (24%) of millennials polled say their parents cover their rent.
About three-quarters of those respondents (72%) plan to take on these bills themselves within the next two years, but 30% admit they will be riding the wave until they’re told otherwise.
Another 31% are trying to save money, saying it is cheaper to stay on their parent’s plan.
Conducted by OnePoll on behalf of Chartway Credit Union, the survey showed that despite not managing all of their expenses, 85% of respondents consider themselves to be financially responsible.
Most respondents (65%) consider having a good credit score to be an indicator of financial responsibility but others weigh lack of debt (64%) and the amount they have in their savings (60%).
In an average month, respondents have six different bills and expenses.
Things like utilities (56%), food (66%), auto insurance (48%), internet (46%) and rent (43%) or a mortgage (40%) add up fast.
Almost three-quarters (73%) of respondents opened their first bank account by their 25th birthday, and 21% opened it before they turned 18.
Even though they may not have had a bank account, 30% of respondents started having their own money to spend by the time they were 15.
Respondents earned their first spending money through an allowance from their parents (58%) and picking up odd jobs around the neighborhood (56%).
Almost seven in 10 (69%) of respondents in the Northeast earned money by helping neighbors, compared to only 43% in the Southeast, fewer than any other region.
“How to spend and save responsibly are lifelong lessons,” Brian T. Schools, President/CEO of Chartway Credit Union, said. “It’s noteworthy to see that over three-quarters of those surveyed have been managing their own money for most of their lives. Still, a third of respondents find it difficult to find helpful resources to manage their finances.”
Today, half of respondents struggle to limit unnecessary spending. They also face difficulty budgeting for unexpected expenses (45%) and remembering to pay bills on time (40%).
On the flip side, only 32% of respondents struggle with their taxes and to keep their credit score high (26%).
Almost two in five (39%) millennial respondents struggle to find resources or information for help with their finances, compared to only 11% of baby boomers, fewer than any other generation.
“While 85% of respondents see themselves as financially responsible when it comes to things like credit scores or savings, ironically, 50% of them struggle with unnecessary spending or unbudgeted expenses, and 40% struggle to remember to pay bills on time,” Schools observed. “Conflicting data such as this tells us that a lot more adults could benefit from some form of financial education, whether it’s provided in schools, online, or by their financial institutions.”
TOP MONTHLY BILLS AND EXPENSES
Groceries/food - 66%
Electric/utilities - 56%
Auto insurance - 48%
Internet/cable - 46%
Rent - 43%
Streaming services - 42%
Mortgage - 40%
Cell phone service - 38%
Monthly subscriptions - 36%
Car payments - 35%
Credit card payments - 31%
Survey methodology:
This random double-opt-in survey of 2,000 general population Americans was commissioned by Chartway Credit Union between Dec. 21 and Jan. 3, 2023. It was conducted by market research company OnePoll, whose team members are members of the Market Research Society and have corporate membership to the American Association for Public Opinion Research (AAPOR) and the European Society for Opinion and Marketing Research (ESOMAR).
29
views

Leaving your kids at home will save you $46 on your next shopping trip
Next time you go shopping, try leaving the kids at home – according to new research, it might just save you money.
A new study has found two in three parents said shopping with their kids tends to be more expensive than just shopping by themselves. Solo ventures cost an average of $133; meanwhile shopping with kids costs an average of $179.
The poll of 2,000 US parents revealed that for 65%, shopping solo allows them to buy different things from different stores than when their kids are around. When shopping alone, parents look for groceries (44%), beauty products (42%), electronics (40%) and clothing (38%).
Shopping together was also found to give kids a chance to spend their own hard-earned money. Of the 61% of parents who give their children an allowance, 78% of them let their kids spend their money in whatever way they see fit.
However, 35% claimed shopping alongside their kids is like pulling teeth — and for many, bribery is the answer.
Commissioned by Slickdeals and conducted by OnePoll, the survey found 44% of parents have to bribe their kids to behave while shopping.
Eighteen percent said they’ve successfully bribed their kids with cold hard cash if they behave themselves. Kids were found to also be swayed by candy (37%), snacks (36%) and toys (34%).
One in four bribing parents even claimed their efforts “always” work.
Parents shared the other weirdest things their kids have asked for while shopping: slime, iPhones, a ferret, pig ear chew toys meant for dogs and even a TAXIDERMIZED alligator numbered among the responses.
“Shopping with kids appears to cost parents more, but there are valuable money lessons that can be learned through the experience,” said Louie Patterson, personal finance manager for Slickdeals. “Including your children in everyday shopping decisions and discussions about larger purchases is a great way to teach them the value of a dollar.”
The survey also found 59% of parents shop both online and in stores with their children.
Many parents see shopping with their children as a chance for their family to bond — 44% prefer shopping in a physical store and 12% prefer to bond while shopping online.
Three in five (62%) turn the shared shopping experience into a lesson for their kids, showing them the value of a dollar (62%), the difference between necessities and nice-to-haves (58%), patience (50%) and how to look for deals (50%).
Respondents recommended starting these lessons with children once they’re nine years old.
Generally, family shopping habits occur four times per month, usually on Saturdays (65%) or Sundays (39%). The busiest months to shop with kids tend to be right around the holidays and back-to-school season: December (45%), November (32%) and August (24%).
TOP 7 THINGS KIDS CAN LEARN WHILE SHOPPING
The value of a dollar - 62 %
Difference between necessities and nice-to-haves - 58 %
Patience - 50 %
How to look for deals - 50 %
What items are needed - 47 %
Where to locate things in a store - 39 %
How to ask for assistance - 37 %
Survey methodology:
This random double-opt-in survey of 2,000 American parents was commissioned by Slickdeals between November 15 and November 22, 2022. It was conducted by market research company OnePoll, whose team members are members of the Market Research Society and have corporate membership to the American Association for Public Opinion Research (AAPOR) and the European Society for Opinion and Marketing Research (ESOMAR).
23
views

3 in 4 travelers pick destinations based on food
Three in four Americans who have traveled in the last five years went for the food (74%), according to new research.
A survey of 2,000 adults found that there’s still more to see — and eat. Respondents said that if they could visit any country based on their cuisine alone, they’d go to Italy, France, Spain and Japan.
Seventy-four percent of those surveyed identify as “foodies” — someone who has a particular interest in food — more so than music lovers, bookworms, and travelers. However, the same percentage of “foodies” said that food doesn’t need to be fancy to be great (74%).
Although baby boomers are most likely to agree (82%), six in 10 also care about the presentation of their food.
While food doesn’t need to be fancy, respondents love a good trend — 56% of respondents learn about new food trends from social media (56%), with 84% of those respondents saying they’re likely to try a trend they saw online.
And most millennials will agree that for them, “the camera eats first” (62%).
Conducted by OnePoll for HelloFresh, the survey found that still, nearly a third of Americans think home-cooked meals are higher in quality than restaurant-cooked (30%) because they’re made fresh (19%), are better for their overall health (19%) and contain better ingredients (17%).
Consequently, most Americans cook on a regular basis (69%), especially Northeasterners (78%), averaging 10 home-cooked meals a week, with 30% of “foodies” making upwards of 13 home-cooked meals a week.
On average, people claimed to know 15 recipes like the back of their hand, even if they no longer cook the dish.
"Preparing and cooking quality meals at home really presents an opportunity for self-proclaimed ‘foodies’ to experiment in the kitchen and get creative (or adventurous!) with the recipes that they create," said Kristin Bryan, Director of Culinary Innovation at HelloFresh. "It's fascinating to see that more than half of people asked are sourcing that inspiration from social media, with the majority trying those trends first-hand.”
When asked to describe their cooking style, respondents most identified with being the “healthy” cook, prioritizing nutritional value (34%), or the quick, speedy cook who tries to finish as soon as possible (30%).
Respondents in the Northeast prefer quick cooking (42%), while 21% of those in the Southeast prefer slow, methodical cooking.
The most commonly attempted recipes come from American (53%), Italian (43%) and German cuisine (34%), with others attempting Chinese food (33%), Caribbean food (20%) or Hawaiian food (13%).
And for many, it may not just be about what you make, but how you make it. Two in three respondents believe their cooking tools or equipment impacts the overall quality of food (67%).
Some of the more popular devices include high-quality knives (44%), a collection of rare spices/seasonings (41%) and multi-kitchen tools (39%).
On the other end of the spectrum, above-the-stove pot fillers (36%), pasta rollers (13%) and smokers (11%) proved to be rare.
Respondents would be interested in adding a double oven (26%), espresso maker (22%) or wok (21%) to live out their “foodie” dreams.
"Cooking with fresh, quality ingredients is essential to making a delicious meal, but it's just as important to prioritize the tools we use in the kitchen," said Bryan. "Using a set of high-quality kitchen knives and adding fresh seasonings and spices to your dishes truly make all the difference in meal preparation."
Survey methodology:
This random double-opt-in survey of 2,000 general population Americans was commissioned by HelloFresh between Jan. 5 and Jan. 6, 2023. It was conducted by market research company OnePoll, whose team members are members of the Market Research Society and have corporate membership to the American Association for Public Opinion Research (AAPOR) and the European Society for Opinion and Marketing Research (ESOMAR).
46
views

What Americans could do with an extra 4 hours in the day
The average American admits they’d need an extra four hours in the day to finish off their to-do list.
A poll of 2,000 adults revealed that 60% don’t believe there are enough hours in the day to get everything done.
If given extra time, respondents’ priorities would shift. One in five (20%) would focus more on projects or tasks they enjoy and 28% would tackle more, larger projects.
While most (34%) would knock out some chores, others feel they’d need the time for some extra sleep (20%).
Some would even open new doors like going back to school (21%) or adopting a pet (19%).
Conducted by OnePoll on behalf of Dave’s Killer Bread, the survey showed that the average person has about five things on their to-do list on any given day — but half (48%) of those items are likely to go unfinished.
Many respondents avoid certain chores because they don’t enjoy them (39%), but running out of time (39%) was an equally common reason.
Things like housework (38%), outdoor work (37%) and laundry (31%) tend to be the first chores pushed aside.
Respondents’ energy levels are depleting well before their heads hit the pillow — most respondents (16%) admit they feel the least energetic between 3 and 4 p.m.
In fact, housework (33%), jobs (28%) and financial responsibilities (27%) drain respondents of their energy the most.
With most of these tasks being part of their everyday lives, respondents are feeling burnt out an average of three days per week.
Most respondents (36%) battle burnout with some extra sleep or by spending time in nature (31%).
“Americans have spoken: They are tired, and they have too much on their plate,” said Watson, Brand Manager at Dave’s Killer Bread. “It only makes sense they’d nix chores from their to-do list. This isn’t a sign of failure, it’s a sign you may need an extra boost to get you through your day.”
Almost two-thirds (65%) of respondents say they can tell how their day is going to go based on the first hour of being awake.
Typically, respondents are pouring a cup of coffee (27%), eating breakfast (24%) or getting some exercise (21%) first thing in the morning.
Almost half (45%) feel more energetic when they start their day off with a meal or snack.
And combatting fatigue isn’t just part of their morning routine — respondents increase their caffeine intake (21%), take a nap (13%) or eat a snack (12%) when they need more energy throughout the day.
“This study shows how daily tasks – like emptying the dishwasher and going to work – impact our energy levels. It’s important to stay fueled throughout the day to combat feelings of burnout,” said Watson. “Starting your day off with a meal, snack, or quick workout, can make all the difference.”
What drains Americans of their energy the most?
Cleaning (housework/chores) - 33%
Preparing for events (holiday, visiting family, etc.) - 28%
My job/work - 28%
Financial responsibilities - 27%
Climate change and other environmental concerns - 26%
Taking care of my family - 24%
Taking care of myself - 21%
Traveling - 18%
Politics - 17%
Survey methodology:
This random double-opt-in survey of 2,000 general population Americans was commissioned by Dave’s Killer Bread between Dec. 13 and Dec. 21, 2022. It was conducted by market research company OnePoll, whose team members are members of the Market Research Society and have corporate membership to the American Association for Public Opinion Research (AAPOR) and the European Society for Opinion and Marketing Research (ESOMAR).
18
views

Introverts reveal hybrid work makes them feel overwhelmed
Working in a hybrid environment? Chances are, you prefer to kick off the workweek from the office.
That’s according to a recent survey of 2,002 employees, which found 46% of hybrid workers prefer to start their week from their company’s HQ, compared to just 20% who favor the comfort of their couch.
Regardless of where people work, results also discovered Monday was reported to be the most productive day of the week (28%), especially among self-reported introverts (39%).
Conducted by OnePoll on behalf of Canon U.S.A., Inc. in connection with the launch of AMLOS (Activate My Line Of Sight), an office solution for hybrid work, the survey uncovered the challenges employees can face in communicating with co-workers, and how these differ based on personality type.
Has hybrid work helped improve employees’ communication skills? Nearly two-thirds (65%) of those who split their time between their home and office seemed to think so, including more introverts than extroverts (82% vs. 62%).
But while 88% of introverts said the hybrid work environment makes them feel like they can come out of their shell, they were also more likely than extroverts to sometimes find this work model overwhelming (80% vs. 64%).
Regardless of where they work, many introverts chose lack of feedback or communication as their biggest daily hurdle (32%), while many extroverts’ biggest barrier was too many channels of communication (21%).
Overall, nine in 10 employees found it challenging to speak up at work, with nearly two-thirds sharing this sentiment while working remotely. Among the reasons? Everyone speaks at the same time (47%), a preference for visual or text-based communication (43%) and not seeing their co-workers simultaneously (40%).
Video seems to have played an integral role in streamlining co-worker interactions, as well as improving productivity. Eight in 10 people who turn on their video while working (1,722 respondents) said meetings feel more productive when everyone else does, as well.
Many respondents also said they’re better able to interact with co-workers when they can share documents, images and videos during a meeting in real time (66%) and see everyone who’s in a meeting (58%).
“As tech continues to evolve, employers need to keep workers engaged,” said Kohei Maeda, marketing supervisor, Canon U.S.A., Inc. “Video is one part of the equation, but often requires complementary tools to help with effective communication in real-time.”
Seven in 10 (70%) respondents agreed new tech tools, such as apps and software, can improve communication at work.
“Companies should equip employees with tech that can improve interaction and allows everyone to engage equally in meetings. When everyone is on the same page, regardless of location, they can not only feel like they’re physically present with the team but are also more empowered to contribute,” Maeda added.
TECH THAT WOULD IMPROVE COMMUNICATION AT WORK
Virtual Reality (e.g., putting on goggles and interacting with a simulated environment) - 48%
Collaboration software (e.g., Slack, Notion, Trello, etc.) - 43%
An AI-powered multilingual translation tool - 38%
Better quality webcams - 37%
More modern, personalized intranets - 36%
An employee onboarding center - 36%
A mobile intranet app - 34%
Survey Methodology:
This random double-opt-in survey of 2,002 employed Americans, including 1,018 hybrid workers, was commissioned by Canon U.S.A., Inc. between September 21 and October 13, 2022. It was conducted by market research company OnePoll, whose team members are members of the Market Research Society and have corporate membership to the American Association for Public Opinion Research (AAPOR) and the European Society for Opinion and Marketing Research (ESOMAR).
19
views

Character traits? These are the ones kids should learn early in life
Eight in 10 (81%) parents think educators should spend time teaching things outside of academics, such as soft skills and current events.
A survey of 2,000 U.S. parents of children ages 0–6 found 62% prioritize their young ones learning soft skills before they’re eight years old, compared to 37% who put math at the forefront.
The most important character traits for kids to learn early in life? Honesty and respect, according to one in five parents.
Conducted by OnePoll on behalf of Kiddie Academy Educational Child Care System for International Day of Education, the survey also found financial literacy (61%) topped the list of non-academic skills schools should focus on in early childhood, followed by sewing or knitting (46%) and internet safety (45%).
Eight in 10 (81%) parents also want their children to have an understanding of current events.
This includes learning about different cultures (60%), the environment (49%), scientific advancements and discoveries (47%) and technology (47%).
Additionally, nine in 10 believe social issues should be part of the early childhood curriculum. Sixty-six percent said children should be taught about the various forms of discrimination that exist in society, followed by healthcare topics such as affordability and access to treatments (61%) and human rights (55%).
The top three teachable moments parents think are most important to include in a child’s early education? Listening to professionals (such as scientists, authors, software engineers) talk about their field (51%), discussing the news (48%) and reading a book together (44%).
“It’s great to see parents recognizing the importance of soft skills in and outside the classroom,” said Joy Turner, vice president of education for the Kiddie Academy brand. “Along with traditional academics and healthy living habits such as fitness, soft skills need to be part of a developmentally appropriate curriculum that helps students learn at their own pace.”
Of the 1,219 parents polled whose children attend school or day care, 95% consider it important that their child’s school reinforces the same values they’re learning at home.
And while nearly nine in 10 (87%) deem their kid’s school curriculum sufficient, parents continue to be actively involved in their child's education. To that end, a similar amount (95%) set aside at least two hours a week to talk to their children about what they’ve learned in school.
“Our research shows parents want to extend the lessons their young ones learn beyond the classroom,” Turner added. “In addition to parents acknowledging the importance of non-academic skills in their children’s lives, 92% believe STEAM (science, technology, engineering, arts and math) should be taught at home, a similar amount to those who want it taught in school (88%). We’ve found the highest quality education programs have a strong focus on the school-to-home connection that fosters family engagement.”
NON-ACADEMIC SKILLS PARENTS THINK SHOULD BE TAUGHT IN EARLY CHILDHOOD
Financial literacy (e.g., filing taxes, budgeting, etc.) - 61%
Sewing/ knitting - 46%
Internet safety - 45%
Gardening - 37%
Cooking/ baking - 35%
Basic home repairs (e.g., painting a room, fixing squeaky doors, etc.) - 35%
Cleaning their room - 34%
SOCIAL ISSUES PARENTS THINK SHOULD BE TAUGHT IN EARLY CHILDHOOD
Discrimination (e.g., based on race, religion, appearance, etc.) - 66%
Health care (e.g., access to affordable care, treatments, etc.) - 61%
Human rights - 55%
Wage inequality - 42%
Climate change - 36%
Immigration - 28%
Hunger/ poverty - 16%
Survey methodology:
This random double-opt-in survey of 2,000 American parents with children ages 0–6 was commissioned by Kiddie Academy between Dec. 23, 2022 and Jan. 2, 2023. It was conducted by market research company OnePoll, whose team members are members of the Market Research Society and have corporate membership to the American Association for Public Opinion Research (AAPOR) and the European Society for Opinion and Marketing Research (ESOMAR).
41
views

Do you want to have a healthier lifestyle? Get your passport and move to Japan
Are you seeking a healthier lifestyle in 2023? Then you may want to find your passport and head to Japan.
A new international poll of 8,000 respondents from Australia, Brazil, Germany, New Zealand, South Korea, Spain, the United Kingdom and the United States revealed out of all 195 nations, 15% believed Japan to be the healthiest — followed by Switzerland (12%), Sweden (12%), Norway (10%) and New Zealand (9%).
Nearly four out of five (78%) of overall respondents said they currently feel healthy.
Out of the eight countries surveyed, respondents from Spain (91%), Brazil (86%) and America (86%) claimed they currently felt healthy — more than the other nations surveyed (76% in the United Kingdom, 74% in New Zealand, 74% in Australia and 73% in South Korea). Meanwhile, respondents from Germany reported feeling the most unhealthy out of the eight nations, with 33% categorizing themselves as currently being “very unhealthy.”
Commissioned by Noom and conducted by OnePoll, the study found that across the globe, most respondents defined “healthy” as being physically fit (31%), exercising regularly (31%), being emotionally happy (30%) and getting adequate sleep on a regular basis (30%).
In the U.S., respondents demonstrated an awareness of the connection between mind and body when it comes to health, reporting that their definition of “health” is both exercising regularly (32%) and being emotionally happy (24%).
In South Korea, health was all about being stress-free (48%). In New Zealand, it was critical to get adequate sleep (34%). In Australia, the top definition was eating plenty of fruits and vegetables (36%).
A majority of respondents (average 57% globally) reported wanting government support in caring for their health — respondents believed that government interventions like improving access to mental health care (34%), making medications more affordable (24%) and banning artificial preservatives (21%) would all positively impact their health and wellbeing.
The survey also revealed the biggest issues impacting both physical and mental wellness on an international scale, providing even more support and evidence of why health solutions must address the two in tandem.
When it comes to mental wellness, respondents report struggling to manage stress around general physical health concerns (48%), the economy (43%), finances (41%), their jobs (40%) and personal responsibilities (32%).
Meanwhile, maintaining family and caregiving responsibilities (17%), romantic lives (14%) and friendships (11%) were found to be among the biggest issues impacting physical health.
Fifty-three percent claimed they take their health more seriously since the Covid-19 pandemic first began. Similarly, 21% said they have felt more productive on an average day during that same timeframe.
Although overall productivity reportedly increased among respondents, some nations felt their productivity has decreased since the onset of the pandemic. Fifty-four percent of South Korean and 46% of American respondents said their productivity throughout their day-to-day lives has taken a dip.
“It is encouraging to see people across the globe thinking about health in multifaceted, holistic ways, and embracing the mind-body connection,” said Saeju Jeong, co-founder and CEO of Noom. “This realistic approach signals that our society is shifting toward more sustainable health practices, a philosophy that we have believed in since our beginning. We hope to see more digital health organizations promote holistic solutions as it’s clear our industry has a continued opportunity to lead dialogues about what true health looks like and how to maintain it for the long term.”
The survey also revealed a possible partisan divide in how U.S. citizens want their government to play a role in their health: 38% of Americans said they want the government to enact policies to encourage healthier living, while 40% disagreed.
Since the pandemic began, 44% of Americans have picked up good habits in some capacity. The factors that most helped them stick with their habits were having support from family and friends (25%), mental health professionals (25%) and digital health programs (24%).
More than half of them (66%) have developed at least five new habits since the onset of Covid-19 that have now become a part of their daily routine.
But for many, adopting healthy habits is still a challenge. In fact, many shared what they would rather do than make the healthy changes needed to lose weight. Specifically, they’d rather give up their favorite streaming apps for a year (20%), two weeks of vacation (20%), sex for a year (20%) and social media for a year (18%).
Survey methodology:
This random double-opt-in survey of 8,000 general population adults from Australia, Brazil, Germany, New Zealand, South Korea, Spain, the United Kingdom and the United States was commissioned by Noom between December 23, 2022 and January 3, 2023. It was conducted by market research company OnePoll, whose team members are members of the Market Research Society and have corporate membership to the American Association for Public Opinion Research (AAPOR) and the European Society for Opinion and Marketing Research (ESOMAR).
62
views

These are the top ways to improve your sleep routine in 2023
If you’re waking up feeling more exhausted than when you fell asleep, you’re not alone. According to new research, the average American wakes up feeling well-rested only three mornings out of the week.
A new study that polled 2,000 US adults about their sleep found the average person doesn’t get anywhere near the quality or amount of sleep they want.
On average, Americans only get six hours of sleep on any given night, while a majority aspire to get eight or more in the new year (58%).
The study, commissioned by Premier Protein and conducted by OnePoll, uncovered that not only were Americans seldom waking up feeling refreshed, but the average person also struggles to wind down before bed nearly half of the week.
Parents in particular claim to struggle with nighttime routines. Thirty-five percent of respondents who were parents said their nighttime routine suffers, with a similar percentage of parents sharing that they have trouble winding down before bed most of the week (34%).
But it’s not just parents — two in three Americans (66%) report that they need a full two hours or more to wind down before being able to fall asleep. Respondents from the Northeast (38%) and “night people” (53%) — those who are happier, more productive or energized during the night — are most likely to struggle with winding down.
“Many don’t realize how their evening routine and eating habits throughout the day can impact overall sleep quality,” said Carissa Galloway, registered dietitian nutritionist, Premier Protein nutrition consultant and personal trainer. “Committing to a consistent and relaxing nighttime routine, as well as making healthy food and drink choices throughout the day can help support a healthy sleep regimen.”
One key factor Americans point to as impacting their sleep routine is nutrition. Nearly half (47%) believe their eating habits have an impact on their ability to relax before bed.
People also have a difficult time relaxing and unwinding before bed when they miss their health goals during the day like indulging in unhealthy foods, snacking instead of eating full meals or skipping meals (37%).
On the flip side, the survey found that foods and beverages like milk (41%), tea (31%), honey (23%), wine (19%) and bananas (19%) were believed by respondents to be the best things to eat before bed to improve sleep quality.
Currently, 39% of Americans rate their sleep pattern — how often they wake up during the night, when they fall asleep, whether or not they wake feeling rested — as below average. Only 8% said they have an “excellent” sleep pattern.
Similarly, more than a third also rate their sleep routine — preparing to go to sleep, nightly routine, usage of sleep time products and bedtime consistency — as below average (36%).
Those who identify as “day people” are more likely to have a “good” or excellent” sleep routine (45%), compared to just 22% of “night people.”
To improve their sleep, Americans are striving to prioritize sleep routines and habits in the new year. Bedtime routines are rising in importance and popularity, with 59% of people setting a 2023 resolution to improve their sleep routine.
People crave better sleep so much, 46% have willingly tried something they saw or read online with the hopes it would help.
But it’s not always easy. Half of the respondents claimed that their quality of sleep has become worse as they’ve grown older.
Two in three Americans have said that being able to wind down before bed does more for their sleep routine than just trying to go to sleep as soon as they can.
“A strong sleep routine is so central to a healthy, happy and energized lifestyle,” said Nick Stiritz, vice president of United States brands at Premier Protein. “It's important to invest in helping consumers commit to a healthy sleep routine and give Americans the tools to relax and unwind before bed in a delicious way.”
This year, Americans will strive to commit to a regular sleep schedule (49%), go to bed earlier (43%) and practice a consistent nighttime routine (38%). Parents are especially determined to have a better sleep routine (60%).
Other tips respondents shared that help them sleep well are to have warm drinks before bed to help them relax (36%), take naps to make up for missed sleep (33%) or have a glass of wine before bed to help their body unwind (18%).
6 WAYS AMERICANS ARE IMPROVING THEIR SLEEP ROUTINE IN 2023
-Practicing a regular sleep schedule - 49%
-Going to bed earlier - 43%
-Committing to a consistent nighttime routine - 38%
-Adding new vitamins and minerals to their nightly routine - 24%
-Experimenting with new products in their nighttime routine - 19%
-Investing in a new sleep supplement - 17%
Survey methodology:
This random double-opt-in survey of 2,000 nationally representative Americans was commissioned on behalf of Premier Protein Good Night Products between November 22 and November 25, 2022. It was conducted by market research company OnePoll, whose team members are members of the Market Research Society and have corporate membership to the American Association for Public Opinion Research (AAPOR) and the European Society for Opinion and Marketing Research (ESOMAR).
151
views

Two-thirds feel guilty for throwing away sentimental items
Most of the items within the average American household arrived there secondhand, new research suggests.
In a recent survey of 2,000 respondents, 66% admitted that more than half of the items in their home were previously owned by someone else.
Seventy-five percent also said they’re comfortable with the idea of buying a gently-used second-hand product in the future.
Maybe that’s why over two-thirds (63%) feel guilty tossing an item that “still has a little bit of life left in it,” or that could be passed on to another household.
One in five (20%) even experience significant guilt every time they declutter, which for half of respondents happens once every six to twelve months.
Conducted by OnePoll on behalf of resale company Winmark, the survey also indicates that three-fourths of people (77%) reported forming emotional connections with the items in their home, regardless of whether or not those items have been used.
Meanwhile, 39% will part with one of their belongings if they believe “someone else will enjoy it more” than they currently do.
When it comes time to declutter, respondents are most likely to relinquish clothing (46%) and papers or other files (44%) above other items like books (29%), toys (25%) or appliances (24%).
But they’re also just as likely to throw unwanted items in the garbage or recycling (36%) as they are to donate the items to charity (36%) or simply give them away (35%).
“Donation services often end up throwing out a lot of goods they receive due to problems with item quality or quantity,” said Renae Gaudette, the chief operating officer at Winmark. “Resale shops, on the other hand, are purchasing the items from you with the intent to resell them, which increases the likelihood that your still-usable items will go to someone else rather than a landfill.”
A whopping 92% of respondents have shopped at second-hand, thrift or resale shops – which a third (33%) believe are among the “most fun” stores to shop at – at least once in their lives.
Four in ten purported to be frequent secondhand shoppers, with almost one in ten (11%) claiming they “exclusively” purchase pre-owned items.
Among those polled, secondhand stores are also thought to offer the most value (37%), just ahead of dollar stores (36%) and outlets (34%)
And although 33% consider an item’s value to be of top importance, sustainability can also play a meaningful role in consumers’ choices – both of the item itself (22%) and of the store it’s being bought from (18%).
“Shopping at your local resale store is a great way to keep money circulating in your home community, and is a much more sustainable practice than even buying used items online, which we know that 61% of our panel cares about,” Winmark Chief Executive Officer Brett Heffes said. “In particular, it cuts down on shipping-related fuel and packaging consumption, which can be just as wasteful as the product manufacturing process itself.”
TOP ITEMS DISCARDED WHILE DECLUTTERING
Clothing - 46%
Papers/files - 44%
Books - 29%
Toys - 25%
Hobby equipment or supplies - 25%
Appliances - 24%
Kids’ items - 24%
Furniture - 22%
Sports/exercise equipment - 20%
Survey methodology:
This random double-opt-in survey of 2,004 general population Americans was commissioned by Winmark between November 7 and November 10, 2022. It was conducted by market research company OnePoll, whose team members are members of the Market Research Society and have corporate membership to the American Association for Public Opinion Research (AAPOR) and the European Society for Opinion and Marketing Research (ESOMAR).
17
views

80% would work from vacation if it meant they could extend their trip
Forget working from home – eight in 10 surveyed remote workers are ready to do their jobs from vacation.
According to a recent survey of 2,000 remote and remote-flexible workers, 80% would consider working remotely from a vacation destination as a way to extend the length of their trip.
That held especially true for respondents ages 26 to 41 (83%), who made up 70% of the polling panel.
Overall, half of those surveyed said they’re just as likely to work on vacation (48%) as they are to work from their local coffee shop (47%).
When asked to choose between a longer trip that involved some remote work and a shorter trip that required no work, twice as many respondents opted for the former (46% vs. 26%).
Conducted by OnePoll on behalf of Marriott Vacations Worldwide, the survey also indicates the average remote worker takes four overnight trips a year, and 83% have taken at least one such trip in 2022.
At the same time, the average remote worker only uses nine vacation days during that same time period, with one in five (22%) taking five days or fewer and nine in 10 (90%) taking fewer than three weeks.
This aligns with similar findings from the U.S. Bureau of Labor and Statistics, which found that most private industry workers (65%) only receive between five and 14 paid days off after one year of service.
Of those surveyed by OnePoll, only 40% claimed that their employer offers unlimited vacation time, and 39% are not compensated for the paid time off they don’t use.
With that in mind, it’s not surprising that 79% of respondents report being more interested in “workcations” now than they were two years ago, and are planning to take anywhere from one to five vacations in 2023.
“The rise of remote work has changed how people think about vacation time and leisure travel,” said Lori Gustafson, EVP, Chief Brand and Digital Officer at Marriott Vacations Worldwide. “The flexibility of no longer being confined to an office has opened up a new opportunity for Americans to give in to their wanderlust and take a ‘workcation.’”
Seven in 10 workers (73%) take more vacation days a year now than they did before working remotely. And more than two in three (69%) believe the flexibility of remote work has improved their overall well-being and happiness.
Remote workers are already accustomed to getting their work done away from their office, too –96% said they frequently do remote work from somewhere other than their home, including 65% who do so frequently.
Not surprisingly, survey-takers cited hotel rooms (25%) and vacation rentals (23%) as the top places they get work done while on vacation – although one in six would even be down to feel productive while sitting poolside (18%).
Location aside, space (36%), quiet (38%) and internet access (42%) are the top three amenities workers look for when selecting accommodations for a hybrid work-vacation.
“Travel is not solely about the location, but about experiences. Those who work remotely from their destination not only have the space to separate the workday from the vacation, but can also enjoy a range of experiences and adventures when the workday comes to an end,” added Gustafson. “When you can work from anywhere, any weekend can be a long weekend to enjoy a vacation, visit friends and family you haven't seen in a while and just make up for lost time.”
15
views

If you clap when planes land, your partner might break up with you: study
The strangest reasons Americans have called it off with a partner include them having dirty fingernails, being rude to a waiter, ugly tattoos — and being too clingy.
A poll of 2,000 adults found over half (65%) have ended a relationship because of an ‘ick’ — trait that turns them off — and 88% of them have ghosted someone completely.
Nearly a sixth (15%) have called it quits with a romantic interest because they were obsessed with star signs, while 14% have ended it with someone who clapped when a plane landed.
An eighth of men (14%) would also happily break it off with someone who wanted to share food on a first date.
And 16% of women find wearing a tacky watch is an ‘ick’, while 15% judge someone else for referring to their favorite sports team as if they were part of the actual team.
The study, commissioned by upscale dating site Seeking and conducted by OnePoll, found simply smelling bad is the top ick, selected by 24% of those surveyed.
This was followed by pretending to be more knowledgeable about something than they really are and being rude to a waiter (both 21%).
But 20% left their would-be paramour totally in the dark and didn’t explain what they’d done to deserve it.
It also emerged 58% believe they have given someone the ick themselves, turning them off totally.
Four in nine (44%) describe themselves as at least somewhat picky when it comes to finding a partner, with 33% being ‘very picky’.
And 79% believe they deserve the best so try to up their standards when looking for a partner, showing the prevalence of the ‘dating up’ trend.
"People are very set on what they want, which is empowering, said Emma Hathorn, spokesperson and in-house dating expert at Seeking. “Online dating has opened a whole new world of singles, which means people can afford to have higher standards.
“And if an absolute deal-breaker for you is someone who never wears sunglasses indoors or chews with their mouth open, that’s absolutely fair enough.”
However, the study revealed 35% believe there is no such thing as being too picky when out on the dating scene, further showing the growing popularity of trying to find more aspirational relationships.
Adding to this, 48% believe their dating standards have gotten higher as they have gotten older — with those aged 65 and up most likely to feel this way.
The research also uncovered how 73% are likely to judge someone negatively if they wanted to split a food bill — particularly if they suggested the date.
While 72% would critique first date location choice if it didn’t meet their standards.
When it comes to looking for a potential partner, 33% said salary is most important, followed by 30% who go for a good sense of style and fashion.
But 40% of adults feel dating does get harder as you increase in years — despite 37% being completely set on dating someone who matches their preferences exactly.
“The current trend in dating at the moment is ‘dating up’ – finding someone who can better and elevate their own lifestyle,” added Hathorn. “So, the goal for all singletons is to not only be someone who can help someone else ‘date up’ — but find someone who can elevate themselves at the same time.
“As with all things in life, it’s about finding that exact balance that works for you, and this can be tricky if you are totally inflexible in who you date. Keeping an open mind is key, and you may find someone who elevates your life in every way possible – even if they wear terrible shoes.”
TOP 40 THINGS THAT GIVE ADULTS THE ‘ICK’
Smelling bad
Pretending to be more knowledgeable about something than they actually are
Being rude to a waiter
Living in a mess
Being overbearing and rude
Having dirty fingernails
Being too clingy
Having bad teeth
Double texting (sending a secondary text if you’ve not responded after the first one)
Talking too loudly
Chewing with their mouth open
Oversharing on social media
Having long fingernails
Referring to themselves in third person
Still living at home
Not wearing socks with shoes
Having shoes that are too dirty
Putting on a baby voice
Breathing heavily
Having a bad tattoo
Eating and talking at the same time
Being obsessed with their star signs
Wearing a tacky watch
Wearing shoes you don’t like
Wearing too much makeup
Wanting to share food on the first date
Not paying on the first date
Clapping when an airplane lands
Talking longer than you to get ready
Referring to their football team as ‘we’
Wearing bad jeans
Having an Instagram account for their pet
Saying pet names like ‘honey’ or ‘baby’
Using emojis in texts
Not being able to drive
Wearing a weird-colored lipstick
Wearing sunglasses indoors
Having too many shirt buttons undone
Wearing creased clothes
Wearing socks to bed
Survey methodology:
This random double-opt-in survey of 2,000 single or actively dating Americans was commissioned by Seeking between November 18, and November 28, 2022. It was conducted by market research company OnePoll, whose team members are members of the Market Research Society and have corporate membership to the American Association for Public Opinion Research (AAPOR) and the European Society for Opinion and Marketing Research (ESOMAR).
670
views