


Country Population Ranking & Projection (2000-2100)
Demography is a social science which entails the statistical study of human populations. Population in simpler terms is the number of people in a city or town, region, country or world; population is usually determined by a process called census.
In this video, we will project the countries by population in the period from 2000 to 2100.
🔔 Please SUBSCRIBE and you will never miss an upload.
#statstube #ranking #population
Facebook: https://www.facebook.com/StatsTubeProduction/
Twitter: https://twitter.com/stats_tube
Website: https://statstube.net/
📊 DATASOURCE
Our World In Data
Thumbnail vector made by Freepik from https://www.freepik.com/
Icons made by Freepik & Roundicons from https://www.flaticon.com/
Free stock background from https://www.pexels.com/
FEW WORDS ABOUT WHO WE ARE AND HOW WE WORK
StatsTube creates unique and original data visualizations as a dynamic timeline to help you pass the monotonous and endless data reading. We’re working very hard to collect the data and then bring it to you in high quality and stunning content by adding educational and creative value in order to make these videos unique.
All of the videos on this channel are created from scratch using a combination of a custom-made code in D3.js, JavaScript, HTML5 and Canvas for animating the charts, Adobe Photoshop and Illustrator for the graphic work, Adobe Audition for the voiceovers and commentary, Adobe Premiere Pro for video editing, Adobe After Effects for advanced visual effects and quality improvements and Streamlabs OBS for 1440p60 high quality recording.
Our videos are not ‘auto-generated’ or ‘reused’ from somewhere and/or someone else, nor ‘repurposing’ someone’s else work in absolutely any way. The process to produce such videos needs a lot of passion, dedication and hard work. More details at https://www.statstube.net/
Thanks for watching. If you enjoyed while watching this video, please do not forget to hit the SUBSCRIBE button, RUMBLE the video and let us know what were your impressions in the COMMENTS down below.
© 2022 Stats Tube // All rights reserved.
162
views
2
comments

Country Ranking by Carbon Dioxide Emission (1960-2014)
Carbon dioxide (CO2) is a colorless formed by combustion of carbon and in the respiration of living organisms and is considered a greenhouse gas. In this video, we will compare the countries by carbon dioxide (CO2) emission from 1960 to 2014.
🔔 Please SUBSCRIBE and you will never miss an upload.
#statstube #ranking #co2emission
Facebook: https://www.facebook.com/StatsTubeProduction/
Twitter: https://twitter.com/stats_tube
Website: https://statstube.net/
📊 DATASOURCE
The World Bank
Thumbnail vector made by Freepik from https://www.freepik.com/
FEW WORDS ABOUT WHO WE ARE AND HOW WE WORK
StatsTube creates unique and original data visualizations as a dynamic timeline to help you pass the monotonous and endless data reading. We’re working very hard to collect the data and then bring it to you in high quality and stunning content by adding educational and creative value in order to make these videos unique.
All of the videos on this channel are created from scratch using a combination of a custom-made code in D3.js, JavaScript, HTML5 and Canvas for animating the charts, Adobe Photoshop and Illustrator for the graphic work, Adobe Audition for the voiceovers and commentary, Adobe Premiere Pro for video editing, Adobe After Effects for advanced visual effects and quality improvements and Streamlabs OBS for 1440p60 high quality recording.
Our videos are not ‘auto-generated’ or ‘reused’ from somewhere and/or someone else, nor ‘repurposing’ someone’s else work in absolutely any way. The process to produce such videos needs a lot of passion, dedication and hard work. More details at https://www.statstube.net/
Thanks for watching. If you enjoyed while watching this video, please do not forget to hit the SUBSCRIBE button, RUMBLE the video and let us know what were your impressions in the COMMENTS down below.
© 2022 Stats Tube // All rights reserved.
3.63K
views
40
comments
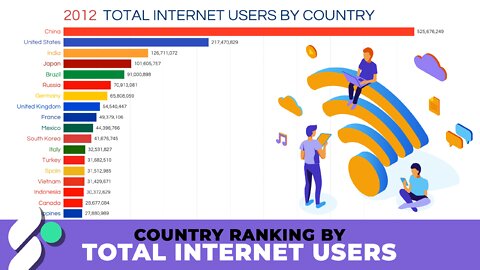
Country Ranking by Total Internet Users (1990-2016)
In the 1990s, the internet was a hard-to-explain concept to people. Even though it’s commonplace now, the idea of electronic mail and being able to surf endless amounts of information without using an encyclopedia was quite foreign. In this video, we will compare the countries by total number of individual internet users from 1990 to 2016.
🔔 Please SUBSCRIBE and you will never miss an upload.
#statstube #ranking #internetusers
Facebook: https://www.facebook.com/StatsTubeProduction/
Twitter: https://twitter.com/stats_tube
Website: https://statstube.net/
📊 DATASOURCE
Our World In Data
Thumbnail vector made by Freepik from https://www.freepik.com/
FEW WORDS ABOUT WHO WE ARE AND HOW WE WORK
StatsTube creates unique and original data visualizations as a dynamic timeline to help you pass the monotonous and endless data reading. We’re working very hard to collect the data and then bring it to you in high quality and stunning content by adding educational and creative value in order to make these videos unique.
All of the videos on this channel are created from scratch using a combination of a custom-made code in D3.js, JavaScript, HTML5 and Canvas for animating the charts, Adobe Photoshop and Illustrator for the graphic work, Adobe Audition for the voiceovers and commentary, Adobe Premiere Pro for video editing, Adobe After Effects for advanced visual effects and quality improvements and Streamlabs OBS for 1440p60 high quality recording.
Our videos are not ‘auto-generated’ or ‘reused’ from somewhere and/or someone else, nor ‘repurposing’ someone’s else work in absolutely any way. The process to produce such videos needs a lot of passion, dedication and hard work. More details at https://www.statstube.net/
Thanks for watching. If you enjoyed while watching this video, please do not forget to hit the SUBSCRIBE button, RUMBLE the video and let us know what were your impressions in the COMMENTS down below.
© 2022 Stats Tube // All rights reserved.
335
views
3
comments
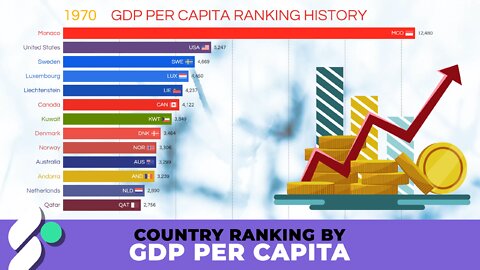
Country Ranking by GDP Per Capita Dynamic Timeline (1970-2017)
GDP per capita is gross domestic product divided by midyear population. GDP is the sum of gross value added by all resident producers in the economy plus any product taxes and minus any subsidies not included in the value of the products. It is calculated without making deductions for depreciation of fabricated assets or for depletion and degradation of natural resources.
In this video, we will see the countries by GDP per capita from 1970 to 2017.
Data is in current U.S. dollars
🔔 Please SUBSCRIBE and you will never miss an upload.
#statstube #ranking #gdppercapita
Facebook: https://www.facebook.com/StatsTubeProduction/
Twitter: https://twitter.com/stats_tube
Website: https://statstube.net/
📊 DATASOURCE
The World Bank
United Nations
Wikipedia
🔊 MUSIC
DD Groove by Kevin MacLeod is licensed under a Creative Commons Attribution license (https://creativecommons.org/licenses/by/4.0/)
Artist: http://incompetech.com/
Thumbnail vector made by Freepik from https://www.freepik.com/
Icons made by Freepik & Roundicons from https://www.flaticon.com/
Free stock background from https://www.pexels.com/
FEW WORDS ABOUT WHO WE ARE AND HOW WE WORK
StatsTube creates unique and original data visualizations as a dynamic timeline to help you pass the monotonous and endless data reading. We’re working very hard to collect the data and then bring it to you in high quality and stunning content by adding educational and creative value in order to make these videos unique.
All of the videos on this channel are created from scratch using a combination of a custom-made code in D3.js, JavaScript, HTML5 and Canvas for animating the charts, Adobe Photoshop and Illustrator for the graphic work, Adobe Audition for the voiceovers and commentary, Adobe Premiere Pro for video editing, Adobe After Effects for advanced visual effects and quality improvements and Streamlabs OBS for 1440p60 high quality recording.
Our videos are not ‘auto-generated’ or ‘reused’ from somewhere and/or someone else, nor ‘repurposing’ someone’s else work in absolutely any way. The process to produce such videos needs a lot of passion, dedication and hard work. More details at https://www.statstube.net/
Thanks for watching. If you enjoyed while watching this video, please do not forget to hit the SUBSCRIBE button, RUMBLE the video and let us know what were your impressions in the COMMENTS down below.
© 2022 Stats Tube // All rights reserved.
3.62K
views
22
comments
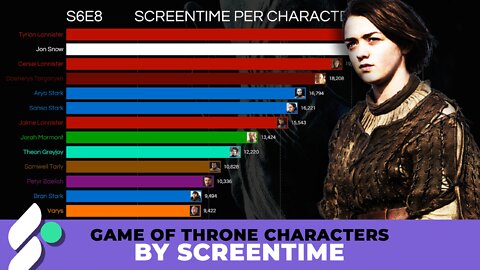
Game of Thrones characters by screen time (2011-2019)
After 8 years and 8 seasons, our favorite TV Series, Game of Thrones has ended. In this video, we'll take a look into how much every character was shown on the screen. All the units are in seconds.
🔔 Please SUBSCRIBE and you will never miss an upload.
#statstube #gameofthrones #got
Facebook: https://www.facebook.com/StatsTubeProduction/
Twitter: https://twitter.com/stats_tube
Website: https://statstube.net/
📊 DATASOURCE
https://jeffreylancaster.github.io/game-of-thrones/
FEW WORDS ABOUT WHO WE ARE AND HOW WE WORK
StatsTube creates unique and original data visualizations as a dynamic timeline to help you pass the monotonous and endless data reading. We’re working very hard to collect the data and then bring it to you in high quality and stunning content by adding educational and creative value in order to make these videos unique.
All of the videos on this channel are created from scratch using a combination of a custom-made code in D3.js, JavaScript, HTML5 and Canvas for animating the charts, Adobe Photoshop and Illustrator for the graphic work, Adobe Audition for the voiceovers and commentary, Adobe Premiere Pro for video editing, Adobe After Effects for advanced visual effects and quality improvements and Streamlabs OBS for 1440p60 high quality recording.
Our videos are not ‘auto-generated’ or ‘reused’ from somewhere and/or someone else, nor ‘repurposing’ someone’s else work in absolutely any way. The process to produce such videos needs a lot of passion, dedication and hard work. More details at https://www.statstube.net/
Thanks for watching. If you enjoyed while watching this video, please do not forget to hit the SUBSCRIBE button, RUMBLE the video and let us know what were your impressions in the COMMENTS down below.
© 2022 Stats Tube // All rights reserved.
1.61K
views
7
comments
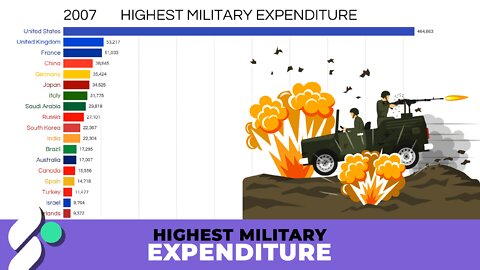
Highest Military Expenditure Countries 1914-2007
The amount of financial resources dedicated by a country for maintaining an armed force is called military budget or military expenditure. In this video, we will see the countries with the highest military expenditure in the period from 1914 to 2007.
🔔 Please SUBSCRIBE and you will never miss an upload.
#statstube #ranking #highestmilitaryexpenditure
Facebook: https://www.facebook.com/StatsTubeProduction/
Twitter: https://twitter.com/stats_tube
Website: https://statstube.net/
📊 DATASOURCE
Our World In Data
Icons made by Roundicons from https://www.flaticon.com/
FEW WORDS ABOUT WHO WE ARE AND HOW WE WORK
StatsTube creates unique and original data visualizations as a dynamic timeline to help you pass the monotonous and endless data reading. We’re working very hard to collect the data and then bring it to you in high quality and stunning content by adding educational and creative value in order to make these videos unique.
All of the videos on this channel are created from scratch using a combination of a custom-made code in D3.js, JavaScript, HTML5 and Canvas for animating the charts, Adobe Photoshop and Illustrator for the graphic work, Adobe Audition for the voiceovers and commentary, Adobe Premiere Pro for video editing, Adobe After Effects for advanced visual effects and quality improvements and Streamlabs OBS for 1440p60 high quality recording.
Our videos are not ‘auto-generated’ or ‘reused’ from somewhere and/or someone else, nor ‘repurposing’ someone’s else work in absolutely any way. The process to produce such videos needs a lot of passion, dedication and hard work. More details at https://www.statstube.net/
Thanks for watching. If you enjoyed while watching this video, please do not forget to hit the SUBSCRIBE button, RUMBLE the video and let us know what were your impressions in the COMMENTS down below.
© 2022 Stats Tube // All rights reserved.
425
views
3
comments

Most Valuable Football Players 2004-2019
In this video, we will see the most valuable football players from 2004 to 2019. Lionel Messi and Cristiano Ronaldo are on the top for the longest period of time but, then Neymar and Kylian Mbappe appeared.
🔔 Please SUBSCRIBE and you will never miss an upload.
#statstube #ranking #mostvaluableplayers
Facebook: https://www.facebook.com/StatsTubeProduction/
Twitter: https://twitter.com/stats_tube
Website: https://statstube.net/
📊 DATASOURCE
Transfermarkt
Icons made by Freepik & Roundicons from https://www.flaticon.com/
FEW WORDS ABOUT WHO WE ARE AND HOW WE WORK
StatsTube creates unique and original data visualizations as a dynamic timeline to help you pass the monotonous and endless data reading. We’re working very hard to collect the data and then bring it to you in high quality and stunning content by adding educational and creative value in order to make these videos unique.
All of the videos on this channel are created from scratch using a combination of a custom-made code in D3.js, JavaScript, HTML5 and Canvas for animating the charts, Adobe Photoshop and Illustrator for the graphic work, Adobe Audition for the voiceovers and commentary, Adobe Premiere Pro for video editing, Adobe After Effects for advanced visual effects and quality improvements and Streamlabs OBS for 1440p60 high quality recording.
Our videos are not ‘auto-generated’ or ‘reused’ from somewhere and/or someone else, nor ‘repurposing’ someone’s else work in absolutely any way. The process to produce such videos needs a lot of passion, dedication and hard work. More details at https://www.statstube.net/
Thanks for watching. If you enjoyed while watching this video, please do not forget to hit the SUBSCRIBE button, RUMBLE the video and let us know what were your impressions in the COMMENTS down below.
© 2022 Stats Tube // All rights reserved.
469
views
7
comments
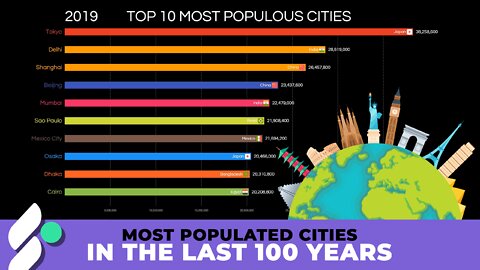
Most Populated Cities In The Last 100 Years (1919-2019)
In this video, we will see the most populated cities in the last 100 years, from 1919 to 2019. Interesting fact is that London was the first city to reach the population of 5 million people.
🔔 Please SUBSCRIBE and you will never miss an upload.
#statstube #timeline #mostpopulouscities
Facebook: https://www.facebook.com/StatsTubeProduction/
Twitter: https://twitter.com/stats_tube
Website: https://statstube.net/
📊 DATASOURCE
World Bank // United Nations
🔊 MUSIC
YouTube Audio Library
https://www.youtube.com/audiolibrary/music
Opus One by Audionautix is licensed under a Creative Commons Attribution license (https://creativecommons.org/licenses/by/4.0/)
Artist: http://audionautix.com/
Thumbnail vector created by Pikisuperstar from https://www.freepik.com/
Icons made by Roundicons from https://www.flaticon.com/
FEW WORDS ABOUT WHO WE ARE AND HOW WE WORK
StatsTube creates unique and original data visualizations as a dynamic timeline to help you pass the monotonous and endless data reading. We’re working very hard to collect the data and then bring it to you in high quality and stunning content by adding educational and creative value in order to make these videos unique.
All of the videos on this channel are created from scratch using a combination of a custom-made code in D3.js, JavaScript, HTML5 and Canvas for animating the charts, Adobe Photoshop and Illustrator for the graphic work, Adobe Audition for the voiceovers and commentary, Adobe Premiere Pro for video editing, Adobe After Effects for advanced visual effects and quality improvements and Streamlabs OBS for 1440p60 high quality recording.
Our videos are not ‘auto-generated’ or ‘reused’ from somewhere and/or someone else, nor ‘repurposing’ someone’s else work in absolutely any way. The process to produce such videos needs a lot of passion, dedication and hard work. More details at https://www.statstube.net/
Thanks for watching. If you enjoyed while watching this video, please do not forget to hit the SUBSCRIBE button, RUMBLE the video and let us know what were your impressions in the COMMENTS down below.
© 2022 Stats Tube // All rights reserved.
2.91K
views
22
comments

@StatsTube / In Data We Trust / Channel Trailer
Welcome to StatsTube. We make creative, educational, valuable and original data visualizations on various and trending topics.
🔔 Please SUBSCRIBE and you will never miss an upload.
Facebook: https://www.facebook.com/StatsTubeProduction/
Twitter: https://twitter.com/stats_tube
Website: https://statstube.net/
🔊 MUSIC
YouTube Audio Library
https://www.youtube.com/audiolibrary/music
Serenity by Aakash Gandhi
Stock footage from https://pexels.com/videos
FEW WORDS ABOUT WHO WE ARE AND HOW WE WORK
StatsTube creates unique and original data visualizations as a dynamic timeline to help you pass the monotonous and endless data reading. We’re working very hard to collect the data and then bring it to you in high quality and stunning content by adding educational and creative value in order to make these videos unique.
All of the videos on this channel are created from scratch using a combination of a custom-made code in D3.js, JavaScript, HTML5 and Canvas for animating the charts, Adobe Photoshop and Illustrator for the graphic work, Adobe Audition for the voiceovers and commentary, Adobe Premiere Pro for video editing, Adobe After Effects for advanced visual effects and quality improvements and Streamlabs OBS for 1440p60 high quality recording.
Our videos are not ‘auto-generated’ or ‘reused’ from somewhere and/or someone else, nor ‘repurposing’ someone’s else work in absolutely any way. The process to produce such videos needs a lot of passion, dedication and hard work. More details at https://www.statstube.net/
Thanks for watching. If you enjoyed while watching this video, please do not forget to hit the SUBSCRIBE button, RUMBLE the video and let us know what were your impressions in the COMMENTS down below.
© 2022 Stats Tube // All rights reserved.
50
views