


Study finds how Americans define productivity
The “Sunday Scaries” may be a thing of the past. Nearly nine in 10 (88%) people say they greatly enjoy completing things on a Sunday, new research suggests.
According to a survey of 2,000 U.S. adults, 64% said waking up early on a Sunday sets their day up for success.
When asked to define productivity, responses varied from getting their to-do list sorted (36%) and spending time with their partner or loved ones (29%) to meal prepping (28%), doing errands (28%) and even sleeping (17%).
And for two-thirds (66%), getting one thing done in a day is enough to feel productive.
Conducted by OnePoll on behalf of Samsung Electronics America, the survey also discovered that staying productive can often come at a cost, with 42% regularly feeling they need to sacrifice time from other activities to maintain momentum.
Forty-two percent frequently scramble to finish some last-minute household chores before a big event on TV, such as a sports game or a series premiere.
And, nearly six in 10 (57%) respondents have missed a major TV moment to get things done around the house.
Those last-minute chores? Washing the dishes (51%), cooking a meal (48%) and taking out the trash (40%).
Nearly half (48%) of people regularly resort to using commercial breaks to get things done.
To make the most of their time, some respondents turn to multitasking, with more than half sharing that they regularly look at a TV screen while multitasking (52%).
People look at an average of two screens while doing other things, and feel most productive with two screens in front of them.
But 47% report feeling stressed when using multiple screens.
While multitasking, people typically use their TV to stream a series or movie (48%), listen to music (40%) or watch sports (36%).
But sometimes, people have other things on their minds. While 56% think about the content they’re watching, 36% are concerned about how many household chores still need to be completed.
“It’s no surprise that people want to make the most of their weekends, but find it hard to stay on top of their chores while also enjoying some much-needed R&R,” said James Fishler, Senior Vice President, Home Entertainment & Display Division, Samsung Electronics America.
“Connected devices are a great way to work smarter, not harder so you can tackle your weekends more efficiently. For example, you can watch the big game on your smart TV while simultaneously video calling a friend all without missing a touchdown, goal or plot reveal. Plus, you can use your smart TV to control your entire smart home from the comfort of your couch: get alerts when your laundry is finished, start your robotic vacuum, pre-heat your oven and even make sure the fridge is stocked.”
WHAT DO PEOPLE POSTPONE TO WATCH TV?
Cleaning up - 37%
Doing the laundry - 27%
Preparing meals - 18%
Spending time with my partner/spouse - 10%
WHAT DO PEOPLE USE THEIR TV FOR WHEN MULTITASKING?
Streaming a series/movie - 48%
Listening to music - 40%
Watching sports - 36%
Scrolling through social media - 26%
Doing chores (e.g., scheduling grocery delivery, coordinating plans for the week ahead) - 25%
Sending/answering messages - 25%
Reading articles/blogs - 17%
–
Survey methodology:
This random double-opt-in survey of 2,000 general population Americans was commissioned by Samsung Electronics America between Oct. 2 and Oct. 5, 2023. It was conducted by market research company OnePoll, whose team members are members of the Market Research Society and have corporate membership to the American Association for Public Opinion Research (AAPOR) and the European Society for Opinion and Marketing Research (ESOMAR).
60
views

IT workers report frequently feeling more like therapists in the workplace
IT help or therapist? A new survey has found three in five IT workers have to ‘frequently provide emotional support’ to users when they encounter a cybersecurity issue.
The poll of 2,000 US employees and IT workers revealed some of the most common accidents and mishaps employees have had with their work computers: spilling coffee or water on it (63%), spilling alcohol on it (63%), dropping it (45%) or falling for a phishing attempt (37%).
As a result, 59% of IT workers have to either “always” or “often” calm down users so they can explain what happened.
65
views
Americans would rather inherit a pet from a loved one than a car
Americans would rather inherit a pet from a loved one than a car, according to new research.
A poll of 2,000 U.S. adults revealed that the top assets respondents would like to inherit one day are a house or property (65%), followed by their four-legged friends (59%) and money (58%).
A little more than half (53%) would like to be passed down collectibles or a car.
Even so, one-third (32%) of Americans haven’t considered what happens to their assets when they die.
Conducted by OnePoll on behalf of Trust & Will, the survey explored how Americans plan for their digital futures.
Americans manage their health and health care (58%), finances (52%), estate planning (51%), and even relationships and friendships (52%) digitally.
In fact, 64% prefer to manage their finances using digital banking platforms over traditional in-person banking methods (24%).
Each year, Americans e-sign, or digitally sign, something an average of five times. Over the past year, those items included health services (56%), offer letters (47%), sales contracts (43%) along with estate planning documents, including wills and testaments (43%).
Digging deeper into future planning, a similar number of respondents both have a will (45%) or are included in someone else’s estate plan (46%).
Half (51%) expect to inherit something from a loved one when they pass, and results revealed that respondents prefer valuable heirlooms to sentimental ones (44% vs 27%).
Two in five respondents admit that they’d be jealous of family members who inherited more than they did.
And it seems that the old saying “you can’t take it with you,”might have lost some appeal; respondents would rather save their money for future generations than spend it all when they’re alive (47% vs 30%).
When asked the most sentimental thing they’d either want or have inherited from a loved one, responses varied from “My dad’s ring,” to “my mother’s watch,” or “a coin from my father that was very important and personal to him.”
For others, it goes much deeper. “Photographs of my family and the special moments I can go look at to remind of a simpler time and the moments of good memories.”
“In today’s tech-focused world, it’s important to transform the traditional, often complex, estate planning journey into a user-friendly, completely customized digital experience. It’s compelling to see that 64% of Americans now prefer managing their finances on digital platforms,” said Cody Barbo, Founder and CEO of Trust & Will. “The significance of planning for the future and ensuring that your loved ones are cared for should not be mired in complexity. We are working to erase barriers that prohibit families from creating a legacy, and are actively supporting legislation that allows people to create and sign their estate plans end-to-end digitally.”
More than half of respondents (59%) correctly identified the difference between a will and a trust.
But when it comes to actually identifying what is included in a will, Americans are less informed. Most know that beneficiaries (65%), instructions for how and when beneficiaries will receive assets (58%), and an executor (53%) are commonly included in a will.
But others incorrectly assume that wills include who has the legal right to your assets while you’re living (41%) and even debts (23%), which is not the case.
“The results underscore a crucial insight: while a good portion of Americans can distinguish between a will and a trust, there's a tangible knowledge gap regarding the specifics of each,” adds Barbo. “It’s important to note that these documents are not mutually exclusive; utilizing both a will and trust creates a robust, comprehensive estate plan, ensuring all aspects of your estate are handled according to your wishes and efficiently distributed to your heirs.”
Survey methodology:
This random double-opt-in survey of 2,000 general population Americans was commissioned by Trust & Will between September 15 and September 20, 2023. It was conducted by market research company OnePoll, whose team members are members of the Market Research Society and have corporate membership to the American Association for Public Opinion Research (AAPOR) and the European Society for Opinion and Marketing Research (ESOMAR).
88
views
2 in 3 only see a doctor when something feels extremely wrong, survey finds
Nearly two-thirds of Americans only go to the doctor when something feels “extremely wrong,” new research suggests.
A recent survey of 2,000 respondents found that 64% take a more reactive approach to their health, rather than a proactive one.
Men polled were particularly susceptible to this – 79% said they only go to the doctor in “extremely wrong”-feeling cases compared to 59% of women.
The survey, conducted by OnePoll on behalf of the Henry Schein Cares Foundation, also found that the average respondent had their last checkup two and a half years ago.
Sixty-five percent have not been screened for high blood pressure within the past five years, and 66% have not been screened for high cholesterol.
Approximately three-quarters of women have not had a mammogram or pap smear in the past five years, and 70% of men have not had a prostate exam in that time.
Overall, only 48% of insured respondents have gone to a physician for a physical exam within the past year.
Only 44% of all respondents have dental insurance, and respondents have gone an average of two years since their last routine dental cleaning or check-up.
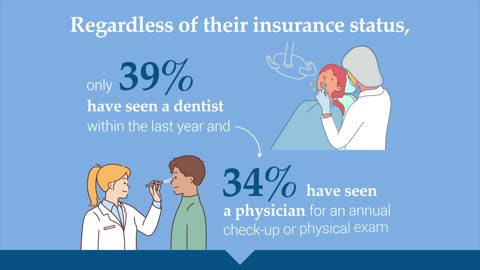
Interestingly, 39% of those polled have seen a dentist within the last year, regardless of their insurance status, compared with only 34% who have seen a doctor for an annual check-up or physical exam.
In general, 78% of respondents said they feel comfortable at doctor appointments, but nearly one-third (27%) were more afraid of going to doctor’s appointments now more than they were before the pandemic.
Still, some of respondents’ least favorite parts of medical appointments don’t involve the doctor at all, such as sitting in the waiting room (29%) and taking the time to go to the appointment itself (21%).
Overall, Gen X and Baby Boomers were the least bothered by medical appointments, while Millennials and Gen Z ranked being touched or examined (22% and 27%), feeling pain (21% and 24%) and overall fear (21% and 22%) as among the top things that they dislike about visiting the doctor.
Results also showed that respondents generally trust their doctor's advice — with two-thirds of the overall group surveyed falling somewhere between “completely” and “mostly” trusting their counsel.
The survey also revealed that one in ten (10%) of Gen Xers said they “never” trust their doctor’s overall medical advice.
The biggest red flags patients look out for are doctors who appear to be disinterested in their well-being (40%).
“Despite all of the evidence underscoring the importance of regular preventive health care and screenings, many patients forgo or delay their care as a result of a lack of health literacy around the importance of preventive care or a lack of personal connection with their provider,” said Maureen Knott, President of the Henry Schein Cares Foundation. “Patients are much more likely to follow through with regular preventive healthcare when they are informed and experience a trust-based and compassionate relationship with their clinicians and all other members of their health care team.”
Overall, more than half (53%) say it is difficult to access medical care, and one in three (35%) say they would benefit from more information and education about the importance of screenings.
Just half (51%) of respondents have a rainy day fund for emergency medical needs totaling an average of more than $2,800 ($2891.15).
“This survey illuminates the structural, financial and behavioral challenges that persist as inhibitors to patients accessing preventative care,” said Allison Neale, Vice President of Public Policy for Henry Schein, Inc. and Managing Director of the Henry Schein Cares Foundation. “Yet regular access to integrated, preventive care has been shown to be a key component of improved overall health outcomes for patients, which benefits not only individuals, but also communities and our whole society through better health, increased productivity and economic growth. As it turns out, the old adage that an ounce of prevention is worth a pound of cure really is true.”
Survey methodology:
This random double-opt-in survey of 2,000 general population Americans was commissioned by Henry Schein Cares Foundation between February 21 and March 2, 2023. It was conducted by market research company OnePoll, whose team members are members of the Market Research Society and have corporate membership to the American Association for Public Opinion Research (AAPOR) and the European Society for Opinion and Marketing Research (ESOMAR).
79
views

Half of women believe they’re just entering their ‘confidence era’
Almost half of women believe they’re only just entering their “confidence era.”
That’s according to a new survey of 2,000 women over the age of 35 which revealed that with turning 38, the average woman earned a new sense of confidence in who they are as a person.
This jump in self-esteem didn’t happen overnight, as nearly one in three (29%) felt least like their true self during their teenage years, downplaying certain aspects of their personality or complying to social norms.
49
views

Average employee spends nearly 11 hours a week drafting emails
The average employee spends 10 hours and 47 minutes a week drafting emails that few recipients read, according to new research.
The survey of 8,000 small business employees (split evenly between Americans and Brits) asked respondents how much time they spend on emails: they draft an average of 112 emails a week, spending just over five and a half minutes on each.
But small business employees surveyed believe their emails are only fully read and understood by their recipients a third (36%) of the time.
40
views

4 out of 10 unable to live off cash savings for this long
Four in 10 Americans couldn’t live off their cash savings for longer than four months, according to new research.
However, three in four (75%) think their saving habits will improve over the next 12 months.
A survey of 2,000 U.S. adults ages 18–58 with a savings account found nine in 10 have tapped into these accounts for emergency reasons since the pandemic began in March 2020.
Those emergencies include unexpected debt (16%), rising rent or mortgage payments (16%) and unforeseen medical bills (14%).
Commissioned by Laurel Road and conducted by OnePoll, the survey also found that although seven in 10 (71%) are satisfied with their current cash savings, there are factors they think can help them save even more.
Those include monthly savings challenges with incentives or prizes (60%), reminders for when their bills are due (52%) and a financial adviser or money mentor (52%).
Only 24% think having a higher income will help them save more money.
On average, people have added $23,474 to their cash savings accounts over the past year, and plan to add a similar amount in the next 12 months ($24,520).
While 42% anticipate withdrawing funds for necessary expenses, 46% will do so to have cash on hand, and 45% will tap into their cash savings account to pay off debt.
People are also using these accounts to save for their children’s education (45%), a new car (43%), retirement fund (40%) and a dream vacation (38%).
Looking ahead to 2024, people’s financial goals include saving for a down payment on a home or apartment (51%), setting a new budget (44%), starting an emergency fund (42%) and improving their credit score (36%).
“Our research shows over two-thirds (67%) are familiar with high-yield savings accounts, but haven’t yet opened one, suggesting there may be knowledge gaps in the benefits this type of account can offer,” Alyssa Schaefer, General Manager and Chief Experience Officer of Laurel Road added. “While 37% said they would use a high-yield savings account for their retirement fund, there are many short-term goals it can help with, as well, from saving up for a family vacation to financing a new car.”
When it comes to their financial habits, 46% rely on recommendations from family and social media, while 45% turn to financial advisers.
Many are keeping up their pre-pandemic savings habits, with a similar amount continuing to pay themselves first (59%), regularly set money aside for a specific purchase (55%) and invest (52%).
“With interest rates currently rising, saving can really benefit your wallet in the long run, especially if you choose a high yield savings account with a high Annual Percentage Yield (APY) over the traditional savings account,” said Alyssa Schaefer, General Manager and Chief Experience Officer of Laurel Road. “It’s important to do your research and find a bank that offers you the option to earn a higher return on your savings. Opening and funding a high yield savings account will allow you to watch your money grow as a result of compound interest, putting you even closer to achieving your financial goals.”
WHAT DO PEOPLE THINK WOULD HELP THEM SAVE MORE MONEY?
● Monthly savings challenges with incentives or prizes - 60%
● Reminders for when my bills are due - 52%
● A financial adviser or money mentor - 52%
● Self-budgeting tools or programs - 42%
● Discounts or coupons - 37%
● Having a higher income - 24%
PEOPLE’S FINANCIAL GOALS FOR 2024
● Saving for a down payment on a home or apartment - 51%
● Setting a new budget - 44%
● Starting an emergency fund - 42%
● Improving my credit score - 36%
● Consolidating or refinancing my debt - 33%
● Paying down or paying off my student loans - 31%
● Getting a higher-paying job - 30%
● Automating monthly payments - 24%
● Finding a money mentor or financial adviser - 21%
● Investing in an asset - 20%
Survey methodology:
This random double-opt-in survey of 2,000 U.S. adults ages 18–58 with a savings account was commissioned by Laurel Road between Sept. 13 and Sept. 21, 2023. It was conducted by market research company OnePoll, whose team members are members of the Market Research Society and have corporate membership to the American Association for Public Opinion Research (AAPOR) and the European Society for Opinion and Marketing Research (ESOMAR).
91
views

Do you know your pet's love language?
The way to your pet’s heart is not only through toys and treats — half of pet parents say physical touch is their furry friend’s love language.
A survey of 2,000 cat and dog owners found that between petting them (83%), giving them hugs (62%) and kisses (55%), respondents are speaking their pet’s love language.
The next most popular pet love language is quality time (27%), which includes letting their four-legged friend sleep in their bed (62%) and bringing their pet along when they can (40%).
Conducted by OnePoll on behalf of Nulo pet food, the survey also discovered that food still speaks to pets, and that their parents aim to provide them with high-quality meals (53%), prioritize their health and nutrition (47%) and add variety to their diet (32%).
Pet parents take showing affection seriously — an astounding 95% of pet owners believe that their pet knows how much they love them.
Almost two-thirds (62%) of pet owners believe that they share the same love language with their pet.
In return, pet parent respondents are on the receiving end of affection in the form of their pet following them around all day (65%), sleeping next to them in bed (58%), giving kisses (48%) and playing with either them or their toys (47%).
Almost half (47%) of pet owners believe that their pet views them as a best friend and 42% agree that they see their pet in the same way.
Others love their pet as if they were their own and see them as a child (38%), while 37% of respondents believe that their pet sees them as a parent.
In fact, this love runs so deep that seven in 10 (69%) of respondents would sacrifice their own diet to provide better quality food for their pet.
Currently, 87% believe that their pet is enthusiastic about their diet, and they’ve been feeding it to them for an average of three years.
But if respondents were in their pet’s shoes, about half (48%) believe they'd only be able to survive eating the same meal every day, multiple times a day for a maximum of three months.
“With 69% of respondents willing to put their pet’s dietary needs before their own, the data clearly shows just how important a role pets play in their people’s lives,” said Heather Acuff, Ph.D., Nulo's Director of Research & Development. “Not only are pet parents speaking their pet’s love language, they’re going above and beyond to provide optimum care and nutrition to ensure the healthiest and happiest lives for their pets. ”
When hunger strikes, it takes less than 10 minutes (9.5) of begging before pet parents give in and feed their pet.
When asked why they feed their pet the diet that they do, respondents believe that their pet enjoys it (50%), they know the ingredients are high quality (35%) and it’s within their budget (29%).
In evaluating whether or not it’s the right diet, respondents look for regular bowel movements (59%), if they sleep well (50%), how smooth or soft their coat is (50%) and their energy levels throughout the day (49%).
“Feeding your pet a high-quality diet is one of the biggest ways you can show them your love and appreciation,” said Acuff. “Pets don’t have the ability to voice their food and nutrition preferences, so it’s up to us as pet parents to do the homework and to ensure that the food we are providing is considerate of their dietary needs, is high quality and offers great taste and variety. There is no doubt that food is one of the most important investments we make in the quality of life for our pets.”
Survey methodology:
This random double-opt-in survey of 2,000 cat and dog owners was commissioned by Nulo between September 22 and September 26, 2023. It was conducted by market research company OnePoll, whose team members are members of the Market Research Society and have corporate membership to the American Association for Public Opinion Research (AAPOR) and the European Society for Opinion and Marketing Research (ESOMAR).
57
views

What are bespectacled Americans missing out on their vacation?
Four-eyes-friendly vacation? A new poll has revealed that half of bespectacled Americans missed out on at least one activity from their vacation because they wear glasses or contacts.
The survey of 2,000 Americans who wear glasses or contacts and travel found that they missed out on activities while traveling including watersports (24%), physical activities (13%) and going to the pool (13%).
A third (36%) said they worry about breaking their glasses or losing their contacts while on vacation and 22% said it has actually happened to them.
As a result, 17% will base their travel decisions around the fact that they wear glasses or contact lenses.
Commissioned by the Refractive Surgery Council and conducted by OnePoll, the study found one third of travelers who rely on vision correction to see, choose to forego their glasses and contacts entirely while traveling, simply because they’re worried it would compromise their experience.
A third said they could probably last less than a day in a foreign country without access to their glasses or contacts. Nearly as many (32%) admitted they would enjoy traveling more if they didn’t need their eyewear.
“For people who need to rely on glasses and contact lenses while traveling, they make compromises they may not even be aware of that can diminish the overall experience – from the activities they choose to where they visit,” said William Wiley, M.D. medical director of the Cleveland Eye Clinic and Clear Choice LASIK Center, who also currently serves as president of the American-European Congress of Ophthalmic Surgery. “These travelers’ issues go beyond the extra pairs of glasses, contact lenses, cases and daily supplies they bring in their luggage to really impacting their travel and, potentially, their eye health.”
The survey also asked respondents how they navigate their travel plans with eyewear. It found eyeglasses were found to be the “top must-have” for 78% of respondents, followed by portable chargers (51%) and prescription sunglasses (24%).
Eyewear being a must-have makes sense, considering how seeing the sights was deemed the favorite activity for 48% of travelers. In fact, 52% of glasses and contact wearers believe vacations “aren’t worth it” if they can’t do some sightseeing.
Other popular activities included eating local cuisine (37%), relaxing (33%) and making new memories (29%).
Fifty-five percent go without their glasses or contacts if they’re in a pool or the ocean. Only 28% would keep their glasses on and 23% would keep their contacts in.
“Travel has been a top priority for many these past few years,” said Wiley. “And while seeing and experiencing new sights is important to invigorating our senses – especially vision – travelers also need to be sure to practice good hygiene and not compromise eye safety because contact lenses aren’t recommended in the pool, the ocean or other types of open water.”
Perhaps as a result of these vacation conundrums, 55% believe having vision correction surgery such as LASIK would make their travel experience better and 40% stated the surgery would protect their investment in travel experiences.
The average glasses wearer owns two pairs of glasses and will bring both with them while traveling or on vacation. Meanwhile, the average contact wearer will bring three extra pairs with them while traveling.
Over half (57%) said they store their glasses and contact lenses in their personal bags whenever they travel — but 36% store them in their carry-on luggage and 12% in their main luggage.
TOP 10 “MUST-HAVES” WHEN PACKING
-Eyeglasses - 78%
-Portable charger - 51%
-Prescription sunglasses - 24%
-Sunscreen - 21%
-Contact lens supplies - 21%
-Eyeglass case - 20%
-Hand sanitizer - 15%
-Water bottle - 14%
-Travel-size shampoo/conditioner - 14%
-Artificial tears or eye drops - 12%
Survey methodology:
This random double-opt-in survey of 2,000 Americans who wear glasses or contacts and travel was commissioned by The Refractive Surgery Council between August 25 and August 31, 2023. It was conducted by market research company OnePoll, whose team members are members of the Market Research Society and have corporate membership to the American Association for Public Opinion Research (AAPOR) and the European Society for Opinion and Marketing Research (ESOMAR).
75
views
How debt can take a toll on your mental health
Debt is an inescapable part of life for many Americans, affecting not only our financial stability but also our mental health and relationships.
Debt stress is real and pervasive, leaving many feeling like they’re drowning in debt and depression.
With a staggering 77% of American households dealing with some form of debt and the cost of living continuing to rise, the pressure of managing debt can negatively impact the well-being of Americans.
A new survey by Forbes Advisor uncovered the impact debt has on Americans’ mental health and how debt affects our relationships, spending habits and outlook on future financial prospects.
How Americans Fall Into Debt
Many Americans find themselves tangled in debt, and there are common reasons why this happens.
● 55% of respondents cited economic circumstances as the principal factor driving them into debt.
● 48% of respondents attributed their debt to the pervasive influence of advertising and consumerism.
● 42% identified difficulties in tracking and controlling their spending as a primary reason for their debt burden.
Where does most of this debt come from? Three-fourths (75%) of people point to credit cards as the main reason they’re in debt. Personal loans are not far behind, with 68% of respondents citing them as a big source of what they owe.
Mortgages cause a lot of financial stress too, with 66% saying mortgage payments contribute significantly to their debt. Over half of the respondents (55%) highlight medical bills as a major reason they owe money.
Together, these factors paint a picture of why so many Americans struggle with debt and how difficult it can be to escape.
How Debt Impacts Mental Health
Dealing with debt isn’t just a financial challenge; it also has significant effects on mental health. According to the survey, 54% of respondents share that they often or always feel stressed by their debt circumstances. Another 32% say they sometimes feel stressed because of their debt.
As a result of debt-related stress, 48% of the respondents reported experiencing sleep difficulties, 40% noted an increase in anxiety levels, 38% reported a diminished social life, and 34% indicated they have depression.
These responses make it clear that debt doesn’t just affect our wallets—it has a serious impact on our mental well-being, making it even more important to find ways to cope and seek help when needed.
How Financial Stress Impacts Relationships
Debt doesn’t just stress out individuals—it puts a strain on relationships, too. A significant 60% of people say that their financial stress has led to disagreements in their relationships.
Of those experiencing debt-related stress, a whopping 86% believe it's hurting their relationships, with 55% saying it’s resulted in a loss of trust between themselves and their loved ones.
The Cycle of Stress and Additional Debt
When people are stressed about money, it often leads to even more financial trouble. In fact, 72% of respondents say they’re somewhat or very likely to go further into debt when they're feeling stressed.
The survey looked at how debt-related stress affected people's spending, here’s what the data revealed:
● 38% of people said they missed payments and incurred extra charges because their debt stressed them out.
● 23% mentioned that stress made it hard for them to manage their money and pay off their debts as they planned.
● More than half of the people (56%) felt guilty when buying things, and 53% felt overwhelmed when they needed to spend more money.
A significant 28% of those surveyed shared that carrying debt triggers impulsive spending. This means that, for some, the pressure and stress of owing money can sometimes lead to seeking temporary relief or comfort through buying. This, in turn, exacerbates the financial strain, creating a cycle in which learning how to deal with debt stress becomes even more challenging.
Tips on Effectively Breaking Free From the Debt Cycle While Prioritizing Mental Well-being
Breaking free from debt is a journey, but it’s one you can navigate with the right tools. Here are some tips to help you find your way while keeping your mental health in check.
Prioritize Your Debt Wisely
The survey revealed that most people prefer paying off their oldest debt first. While this seems logical, it doesn’t always make the most financial sense.
There are many different types of debt — and some are more damaging than others. Instead of focusing on the oldest or smallest balance, it can be more helpful to pay off the debt with the highest interest rate first. This is known as the debt avalanche method, and it can be especially helpful if you have credit card debt stress. With this method, you can save money on interest and pay off your debt faster.
Cut Back on Non-Essentials
Consider using a budgeting app to get a closer view of your spending. Are you buying items you don’t really need? Could you save money by dining out less or canceling subscriptions? Finding areas to pull back on your spending can free up money and help you pay down debt faster.
Before buying something, ask yourself if it’s a need or a want. This can be especially helpful if your debt anxiety leads to impulse purchases. Thinking through non-essential buys and potentially delaying them can help curb impulsive spending and keep your budget in check.
Practice Money Mindfulness
“Financial anxiety can be debilitating, and it often presents itself in physical ways like sleep disruptions, changes in eating habits or obsessively checking your bank accounts,” says Jacqueline Howard, head of money wellness at Ally Bank. While money can be stressful, Howard assures readers there are ways to overcome their financial anxiety.
“When your brain is stressed, it can be difficult for you to make rational, forward-looking decisions,” says Howard. “It’s important to first acknowledge the increased anxiety, then pause and allow your brain to calm down so that you can better problem-solve." Howard calls this practice "money mindfulness," which involves stopping to observe your thoughts, actions and emotions when you spend money.
Howard also promotes conscious spending as a way to reduce financial anxiety. “This practice lets you spend without shame on things you absolutely love and cut back on things that are less important. For example, if you’re a foodie who wants to visit a Michelin-star restaurant once per quarter, but you don’t care about driving a fancy car, budget for the foodie experience and cut back on how much you spend on a car.”
Build a Safety Net
Saving money while paying off debt might sound tough, but having an emergency fund is important. Start small. Even a little money set aside can stop you from going further into debt when unexpected expenses pop up.
Consider opening a separate high-yield savings account specifically for emergency savings. You’ll earn interest on your balance each month, and the money will be out of sight and out of mind. Once you build the habit of saving money, it’ll get easier to leave that money alone and let it grow.
Work With the Right Debt Settlement Companies
Another tip is to consider working with a debt settlement company. But be careful—while the best debt settlement companies can help you lower your debt, some can make things worse.
Do your research. Look for companies with good reviews, and ask lots of questions. Make sure you understand how they work and what they charge. Avoid companies that ask for money upfront or make promises that sound too good to be true.
Stay Positive and Seek Support
Break your financial goals into smaller, manageable tasks that feel more achievable. Celebrate small victories along the way to keep yourself motivated.
Remember, taking care of your mind is as important as taking care of your wallet as you pay off debt. Confronting anxiety about debt head-on and finding coping strategies is crucial. Educate yourself on the connection between debt and mental health. Find stress-relieving activities that work for you, whether that’s exercise, meditation or talking to a counselor.
Survey methodology:
This online survey of 2,000 U.S. adults with debt was commissioned by Forbes and conducted by market research company OnePoll, in accordance with the Market Research Society’s code of conduct. Data was collected from Sept. 15 to Sept. 18, 2023. The margin of error is +/- 2.2 points with 95% confidence. This survey was overseen by the OnePoll research team, which is a member of the Market Research Society and has a corporate membership with the American Association for Public Opinion Research (AAPOR).
133
views
1
comment

Top challenges veterans experience after active duty
It takes seven months for veterans to feel they’ve adapted to civilian life after active duty, new research suggests.
A new survey of 1,000 U.S. military veterans revealed there are an average of three different major challenges on this journey.
Finding a job topped the list, with a third (33%) of respondents calling it their biggest hurdle. Other challenges included parting ways with their friends in the military and finding a purposeful career (28% each).
Conducted by OnePoll on behalf of Sport Clips Haircuts for its VFW’s “Sport Clips Help A Hero Scholarship” program, the survey also found that six in 10 (60%) veterans already had long-term goals in mind after leaving the military.
These goals included finding a purposeful civilian job (56%), homeownership (52%), and getting married and having children (46%).
“From serving their country to serving their communities, veterans bring an array of transferable skills to their civilian careers,” said Gordon Logan, founder and chairman of Sport Clips, and Air Force veteran. “While a meaningful job and career were a top goal for many, they may not have always been aware of all the resources available to help support them in their journey. It’s important to ensure the next generation of veterans knows about support programs and other services offered by veterans organizations such as the VFW.”
Some also noted milestones they had yet to experience when they left the military, such as pursuing higher education or a college degree (27%).
One in five (20%) revealed they had never created a resume at that point in time.
While the military taught many transferable skills, such as the ability to perform under pressure (50%), teamwork and collaboration (41%) and problem-solving (39%), it took an average of four months for veterans to find a civilian job.
To help boost their self-confidence during the adjustment to civilian life, a third of veterans (33%) took classes or continued their education.
Twenty-nine percent also credit their partner or spouse with helping them transition after their service.
Additionally, veterans shared their biggest tips in transitioning to civilian life, including taking your time to get adjusted, keeping a daily routine, starting to save your money before leaving the military, and continuing your education.
“One in five veterans polled said a lack of funds prevented them from pursuing their educational goals,” Logan added. “Whether they’re a first-time college student or continuing their education, the Help A Hero scholarship program gives service members and veterans can get the assistance they need to further their studies without incurring excessive debt.”
VETERANS’ BIGGEST NON-HEALTH-RELATED CHALLENGES IN TRANSITIONING TO CIVILIAN LIFE
● Finding a job - 33%
● Parting ways with my friends in the military - 28%
● Finding a purposeful career - 28%
● Absence of familiar routine/structure - 23%
● Pursuing educational goals - 15%
● Adjusting to providing basic necessities (e.g., food, clothing, housing) - 15%
● Lack of financial support - 14%
● Reconnecting with family - 11%
● Unfamiliarity with post-military programs/resources - 11%
● Finding a new identity - 9%
● Lack of family/community support - 5%
Survey methodology:
This random double-opt-in survey of 1,000 U.S. military veterans was commissioned by Sport Clips between Sept. 26 and Oct. 2, 2023. It was conducted by market research company OnePoll, whose team members are members of the Market Research Society and have corporate membership to the American Association for Public Opinion Research (AAPOR) and the European Society for Opinion and Marketing Research (ESOMAR).
72
views

Research finds how seniors stay healthy
Two-thirds of Americans 65 and older admit they wish they’d taken their health more seriously when they were younger, according to new research.
A survey of 2,000 U.S. seniors looked at how they meet their fitness and health goals and found that 46% admit they don't have any in place.
Even so, 86% of seniors take their health more seriously now than when they were younger.
While almost two in five (39%) say they tend to take a proactive approach to their health, only 32% will seek out their doctor as soon as they start to feel unwell.
Others tend to wait out the storm and hope to feel better (22%) or try to remedy themselves (42%).
Conducted by OnePoll for ClearMatch Medicare, the survey showed that a whopping 81% of seniors polled admit their health could be better, despite the average respondent exercising about five times per week.
While 42% exercise most frequently inside their homes, 24% head outside and 15% go to the gym.
Most seniors (71%) are getting their steps in and walking to stay in shape. Others lift weights (25%), bike (20%), run (20%) or even do yoga (19%).
Half (51%) of seniors do have health or fitness-related goals and, over the past 12 months, have been successful in meeting goals pertaining to exercising more often (43%), drinking more water (34%), taking vitamins (28%) and even getting more sleep (15%).
Result also found that while most seniors tend to follow their doctor’s orders (79%), 14% will stray from their advice.
The most common advice seniors ignore from their doctors is to exercise frequently (21%), followed by eating nutritious foods (16%).
Others ignored being told to attend doctor appointments regularly (13%) or even to take medications regularly (12%).
“Many seniors have expressed regrets about not prioritizing their health in their younger years. However, the data unequivocally demonstrates that it's never too late to start.” said Ben Pajak, CEO of ClearMatch Medicare, a part of HealthPlanOne, LLC. “Everyone should consider setting fitness goals to maintain their optimal health, and it's worth noting that the majority of Medicare Advantage plans currently provide fitness benefits to support older Americans in their self-care efforts and active lifestyles.
Currently, the average senior visits their doctor about three times a year.
In the past, barriers like a fear of what the doctor will tell them (20%) and lack of motivation (18%) have stood in the way of actually attending the visit.
But today, almost one-third (30%) believe that they would visit their doctor less frequently now if they had taken better care of their health when they were younger.
Despite the availability of fitness benefits through Medicare Advantage plans, it’s surprising that 53% of enrollees acknowledge not utilizing these offerings,” says Vice President of Sales, Jennifer Girdler. “It's important to take advantage of every opportunity and maximize the extra benefits that Medicare Advantage plans provide."
Survey methodology:
This random double-opt-in survey of 2,000 Americans aged 65+ was commissioned by ClearMatch Medicare between August 31 and September 9, 2023. It was conducted by market research company OnePoll, whose team members are members of the Market Research Society and have corporate membership to the American Association for Public Opinion Research (AAPOR) and the European Society for Opinion and Marketing Research (ESOMAR).
54
views

Average homeowner finds bugs and pests five times per week
When bugs or pests cross their path, one in 10 Americans enter ‘exterminator mode’ faster than you can say “buzz off”.
More specifically, according to a new survey of 2,000 homeowners or renters with a yard or lawn, 15% of respondents will squish a bug regardless of where they see it — inside or outside.
That number is higher when looking at indoor squishers — 43% said if bugs or pests are found inside their home, only then would they kill it. A third (32%) will do the same solely to bugs they see outside.
62
views
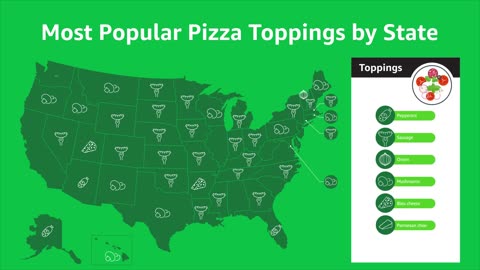
3 in 4 would eat pizza for any meal of the day
How much pizza do you estimate you can eat? The average American reveals they eat enough pizza per year to stuff a full-sized suitcase with cheesy ‘za.
A state-by-state poll of 5,000 US adults found the average person can eat over half (five slices) of an entire pizza by themselves in a single sitting and eats pizza three times in any given month — an equivalent of 180 potential slices in a single year.
The study also revealed more Americans prefer frozen, ready-to-bake-at-home pizza (30%) than they do eating fresh pizza in a restaurant (26%) or even delivery pizza (16%). Perhaps that’s why nearly half (48%) prefer pizza hot and fresh out of the oven.
41
views

Do you know the difference between Hispanic and Latino?
Americans are split when it comes to knowing the difference between the terms Hispanic and Latino, new research suggests.
Out of 1,250 adults surveyed, which includes 250 U.S. Hispanics/Latinos, 41% selected the correct answer: Hispanic refers to someone whose country primarily speaks Spanish, and Latino refers to those with origins from Latin America (Mexico, South and Central America) and the Caribbean.
Two in five, in fact, believe the opposite (41%), and 11% didn’t know the difference between Hispanic and Latino.
When asked what Latinx and Latine represent, respondents had a better idea of what the terms describe.
A third (32%) knew Latinx and Latine are gender-neutral terms. However, 29% thought they were used to describe the younger generation, and 23% thought they were used to describe the older generation. Almost a fifth had no idea what Latinx and Latine represent (16%).
The survey by OnePoll also asked respondents how they view and observe Hispanic Heritage Month, with 66% saying they celebrate it.
Although a majority believe it’s important for society to learn about Hispanic heritage (85%), a similar percentage of people said they wish they knew more about Hispanic/Latino culture (81%).
Similarly, 84% said they wish they had learned more about other cultures as a child.
Hispanic and Latino respondents were also asked to reflect on their social and professional lives, revealing that 52% think their non-Hispanic/non-Latino peers understand their culture “very well.”
More positively, 74% said they feel their Hispanic/Latino culture is represented well in mainstream society.
In the workplace, two in five said their jobs are majority Hispanic/Latino (44%), with 43% reporting most of the management/executive positions are Hispanic/Latino.
57
views

Survey reveals how many cups coffee drinkers consume per year
For four in five coffee drinkers, the idea of drinking coffee in the morning is what motivates them to get out of bed, according to new research.
The survey of 2,000 American coffee drinkers revealed this is true for 81% of respondents — and respondents are so reliant on coffee, they’ll consume an average of 460 cups per year.
Within the survey, respondents were split by their favorite style of coffee — hot coffee (48%), cold brew (20%), iced coffee (18%), frozen or blended coffee (7%) or espresso-based (5%).
Those who prefer cold brew and hot coffee were most likely to be motivated by coffee in the morning (86% and 83%, respectively), compared to those who prefer iced coffee or frozen or blended beverages (76% and 66%, respectively).
Commissioned by BUNN and conducted by OnePoll ahead of National Coffee Day, the survey further examined respondents’ love of coffee and how they create their favorite brew.
Many respondents would go so far as to give up social media over their morning brew — especially those surveyed who prefer hot coffee.
Forty-two percent of hot coffee drinkers (who use social media) would prefer to give up their online account instead of their coffee, while only 17% said the opposite.
Cold brew drinkers were more evenly split, as 31% would give up social media, compared to 38% who would give up coffee.
And results found that respondents love their coffee drinks so much that 48% have tried to recreate their favorite cafe beverage at home.
These attempts are pretty successful, too — 92% of those who’ve recreated a beverage said they were satisfied with the results.
Despite that, making coffee at home still isn’t the same as having an expert do it: the survey found 71% of respondents find it important to have their coffee prepared by a skilled barista.
“Whether it’s that fresh-hot cup from the kitchen coffee maker or a crafted beverage from a coffee shop drive-through, Americans have a long-standing love with their coffee routine,” said Brandi Goodin, BUNN Vice President of Marketing Communications. “We have always been driven by the relentless pursuit of the highest-level brewing techniques for the best result in the cup — from a home coffee maker or the most sophisticated commercial brewing systems.”
Results also found that only 27% of coffee drinkers would rate the beverages they make at home “excellent” — and respondents admit to facing a variety of challenges.
When making coffee at home, respondents said they can struggle to measure the right amount of coffee (48%), select the correct grind size (48%) and select the correct filter (44%).
But that doesn’t mean respondents aren’t hoping to improve their at-home brewing skills — and 74% said they’re likely to try out new coffee brewing methods.
Coffee drinkers surveyed are most concerned with the ease of preparation (61%), when it comes to their preference for how their coffee is made. That was followed by the cost of equipment (51%) and the prep and brew time (44%).
“Brewing coffee is a scientific process with a range of variables including brew time, temperature and turbulence to create the perfect cup,” said Goodin. “For those looking to improve their coffee-brewing skills at home, my advice is to experiment with different techniques, like variations in grind size or adjusting the amount of coffee used.
“While measuring correctly and using quality coffee beans are vital, the importance of having the right equipment cannot be overlooked. Investing in the right brewing equipment will elevate your coffee experience to new heights. Bottom line: find what works for you and have fun with it!”
Survey methodology:
This random double-opt-in survey of 2,000 Americans who drink coffee was commissioned by BUNN between Sept. 5 and Sept. 8, 2023. It was conducted by market research company OnePoll, whose team members are members of the Market Research Society and have corporate membership to the American Association for Public Opinion Research (AAPOR) and the European Society for Opinion and Marketing Research (ESOMAR).
154
views

Americans celebrate this many 'parenting wins' per week
The average parent has a whopping 190 “parenting wins” and 218 “cave-ins” a year, new research suggests.
Parents’ top three “wins” are when their kid takes care of their hygiene (16%), gets dressed in time for school (15%), and eats fruits and vegetables (14%). The top three “cave-ins” include letting their kid eat the foods and snacks they want (21%), letting them have dessert before dinner (18%) and giving them a device during mealtime (17%).
This is according to a survey of 2,000 parents with school-age kids that looked at how parents celebrate small successes, especially with eating healthy foods and using digital devices, with their young ones.
To get children to eat healthily, parents set up a reward system (17%), add dressing, sauce, dip, whipped cream or ice cream to their kid’s food (14%), and use utensils or dinnerware with characters (11%).
Conducted by OnePoll and commissioned by OmniActive Health Technologies for its “Lutein for Every Age” initiative, an education program focused on children’s eye health and the importance of incorporating key nutrients like lutein and zeaxanthin into diets, results also found some parents chose the stealthy route, hiding veggies in other dishes their kids enjoy.
Mac n’ cheese and cupcakes tied for the No. 1 easiest food to sneak vegetables into (16% each), followed by muffins (14%) and pureed soups (10%).
At the same time, nine in 10 catch themselves caving into their kids’ requests, and most parents cave after only three asks; ironically, 61% say it’s “easy” to say no to their child’s request.
As it relates to vision check-ups, nearly one in five parents (17%) said their kid’s vision has gone unchecked for three or more years. The American Optometric Association (AOA) recommends eye exams for asymptomatic children once between 6–12 months of age, at least once between ages 3–5, then before first grade and annually thereafter.
Interestingly though, according to the data, six in 10 parents regularly worry about their child’s eye health, more than other aspects of their well-being, but are unfamiliar with ways they can support it.
In fact, only 21% give them vitamins and supplements to protect their vision and 23% give them fruits and vegetables that contain vitamins/minerals for eye health. And the top foods/beverages that parents serve their kids to support eye function are milk, apples, and salmon.
Drilling down into more food specifics, while carrots rank in the top spot in fruits or vegetables that parents think support eye health (15%), according to the American Academy of Ophthalmology (AAO), dark leafy greens such as kale are better, because of their high concentration of lutein and zeaxanthin. In the survey, kale ranked last among foods parents think help support vision, suggesting knowledge gaps in nutritional needs for eye health.
“This survey shows that many adults don’t know what foods or beverages support their kids’ eye health, yet it’s a major health concern of theirs,” said Keri Glassman MS, RD, CDN and Nutritional Advisor for OmniActive’s Lutein for Every Age initiative. “Kale, along with spinach, pumpkins, sweet potatoes, and egg yolk, for example, have lutein and zeaxanthin, two major carotenoids that help protect our eyes, and that naturally occur in the eye’s macula and brain. Since kids generally don’t eat a lot of these foods, look for fortified beverages and supplements with lutein and/or zeaxanthin to help maintain their eye health alongside encouraging them to incorporate these foods into their diet.”
Also, the survey found that three in four (75%) parents try to reduce their kid’s screen time in favor of outdoor time at least once a week, as the average child spends four hours a day using digital devices. This equates to over 1,500 hours a year — and that’s only the screen time parents know.
Only 13% of parents give their child blue light glasses to use when they’re on their devices.
“Taking care of our eyes starts from the inside, like eating nutrient-dense foods, and works best when adding extra protection on the outside, such as wearing sunglasses,” said Dr. Joseph Allen, OD, FAAO, Dipl ABO and Vision Advisor for OmniActive’s Lutein for Every Age initiative. “With the amount of time kids spend on digital devices, it’s important for them to take consistent breaks so their eyes can recover from digital fatigue. I recommend setting time limits on devices and getting outside as much as possible. In fact, research shows that spending around 13 hours a week outside is associated with a decrease in myopia or nearsightedness.”
TOP PARENTING “WINS”
● When my kid takes care of their hygiene - 16%
● When my kid gets dressed in time for school - 15%
● When my kid eats fruits and vegetables - 14%
● When my kid wakes up in time for school - 14%
● When my kid goes outside to play or hang with friends - 9%
● When my kid spends time with me/other family members - 9%
● When my kid does their homework/ studies - 5%
TOP PARENTING “CAVE-INS”
● Letting them eat the foods and snacks they want - 21%
● Letting them have dessert before dinner - 18%
● Giving them a device during mealtime - 17%
● Buying them what they want - 13%
● Letting them have more screen time - 13%
● Letting them go out with their friends - 10%
● Letting them stay up later - 5%
–
3.66 “parenting wins” a week x 52 weeks = 190.32 a year
4.19 parenting “cave-ins” a week x 52 weeks = 217.88 a year
The average child spends 4.13 hours a day using digital devices x 365 days in a year = 1,507.45 hours a year
Survey methodology:
This random double-opt-in survey of 2,000 parents with school-age kids (ages 5–18) was commissioned by OmniActive Health Technologies between Aug. 25 and Aug. 29, 2023. It was conducted by market research company OnePoll, whose team members are members of the Market Research Society and have corporate membership to the American Association for Public Opinion Research (AAPOR) and the European Society for Opinion and Marketing Research (ESOMAR).
66
views

Hourly workers less confident about having a comfortable retirement
Only half of hourly employees feel they will be able to retire comfortably.
A survey of 2,000 employees split evenly between salaried and hourly workers revealed that hourly workers are less confident they will retire comfortably compared to salaried workers (53% vs. 63%).
Among hourly workers, one in three (33%) admitted they were “winging it” when it comes to their retirement plan.
Conducted by OnePoll on behalf of retirement benefits provider Human Interest, the survey found that a quarter of employees say their employer does not offer a retirement savings plan at all.
Hourly workers making less than $60,000 a year had even less access than salaried workers making the same amount (28% with no access for hourly workers vs. 21% for salaried workers).
That lack of access may impact workers’ financial independence during retirement years — 54% of hourly workers say they will be somewhat or very reliant financially on a family member.
Compared to salaried workers, hourly workers are twice as likely to say they do not have any other family member they can rely on.
The average worker is only saving 70% of what they plan to withdraw annually every year in retirement.
While the average employee currently has $128,815 saved for retirement, they anticipate needing to withdraw $184,850 annually upon retiring.
In addition to these challenges, many hourly workers are the first in their families to have access to retirement savings.
Nearly a third (32%) of hourly workers said their parents and grandparents did not have access to retirement savings plans, compared to 24% of salaried employees.
Some workers are delaying or omitting certain purchases in favor of funding their retirement, including home improvements/repairs (48%), a vacation (45%), and even a wedding (39%).
Even considering all these retirement savings access challenges, a strong majority (73%) of workers are likely to embrace “pretirement,” an emerging life stage between full-time work and retirement in which hours are reduced and people consider new job roles.
Of those planning to “pretire,” 39% expect to pivot to a new job in a different industry.
“Both hourly and salaried workers seek flexibility and choices in retirement planning, but we've seen that hourly workers overwhelmingly lack access to plans in the first place,” said Kristina Wallender, Chief Experience Officer at Human Interest.
Men were much more confident they could comfortably retire compared to women (66% vs. 51%), an indication of pay equity gaps and fewer savings opportunities for women.
More men are likely to pretire than women (79% vs. 67%). This may be a result of the gender savings gap — 52% of women have currently saved less than $100,000 for retirement, compared to 45% of men.
“Our survey found that four out of every 10 people find it hard to talk about saving for retirement with anyone other than a spouse,” said Wallender. “We need to bring the conversation about saving for retirement out in the open so that talking about it becomes a social norm.”
PURCHASES PEOPLE ARE DELAYING IN FAVOR OF THEIR RETIREMENT FUND
● Home improvements/repairs - 48%
● A vacation - 45%
● A wedding - 39%
● Continued education - 37%
● Traveling - 36%
● A vehicle - 35%
● Real estate - 31%
Survey methodology:
This random double-opt-in survey of 1,000 salaried and 1,000 hourly employed Americans was commissioned by Human Interest between July 27 and July 31, 2023. It was conducted by market research company OnePoll, whose team members are members of the Market Research Society and have corporate membership to the American Association for Public Opinion Research (AAPOR) and the European Society for Opinion and Marketing Research (ESOMAR).
35
views

Average American takes this many photos a day
The average American whips out their phone to take a photo six times each day.
A survey of 2,000 U.S. adults revealed that camera rolls are flooded with group photos with friends (66%) and family (69%) as well as photos of friends (63%) and family (58%) without them in it.
Selfies (58%), pet pics (52%) and scenery (43%) also topped the list of frequent photos.
Respondents are likely to take photos at events such as graduations (45%), weddings (44%), on vacation (40%) and at sporting events (37%) — with the average person taking nearly 23 pics per event.
Following the event, respondents will look back on those photos a little more than once per month, or 13 times per year.
Respondents admit they spend nearly 40% of the event on their phone taking photos. This may be because 45% feel like they need to take pictures in order to remember the event in detail.
Conducted by OnePoll on behalf of Mixbook, a photo book brand, results also revealed that the average person has nearly 3,000 photos (2,795) in their camera roll, and would like to print out more than one-third of them (34%).
Despite 70% of respondents intending to print out the photos they take at least sometimes, only 19% “often” do so, while 22% “rarely” get around to it.
Most commonly, respondents keep the photos they take to themselves (61%). Others look back on them to relive the memories (55%) or post them on social media (53%).
But respondents’ favorite photo on their camera roll seems to be more personal than an Insta-worthy selfie. Those include, “a picture of myself and my three great-grandchildren,” “my cat that passed at 23 years of age,” “the ones of my mother” and “my cat and dog playing with each other.”
"Photos have this magical way of freezing moments that might otherwise slip away. Each snapshot captures a chapter of our lives, a cherished memory that ties us closer to our loved ones through shared experiences,” said Andrew Laffoon, CEO at Mixbook. “We understand the importance of finding the stories in these moments and help turn them into tangible keepsakes that can be shared and enjoyed together for generations."
When asked how photo-taking habits have changed over the last five years, 31% say they take more photos and 26% take fewer.
Of those who take more photos, it’s most commonly attributed to a desire to share them with friends and family (75%).
On top of that, respondents want to look back on them later (68%), memorialize what they look like now (62%) and to remember everything (56%).
On the flip side, those who take fewer photos blame a lack of memory on their phone or camera (59%), not knowing what to do with the photos they take (57%) and having fewer things to take photos of (53%).
But when it comes to scouring their camera roll for certain photos from the past, most respondents (54%) find it to be overwhelming.
“In today’s digital age our camera rolls have become digital black holes where the stories behind our photos are getting lost. This makes it tough for people to hold onto the memories that truly matter,” said Laffoon. “We help customers not only organize the photos but also curate the important, photo-worthy moments. This way, they can transform them into keepsakes that celebrate the people and moments they never want to forget.”
HOW DO AMERICANS DECIDE WHAT TO TAKE PHOTOS OF?
● Because they want to look back at the moment later - 65%
● It’s something unusual/something they’ve never seen before - 61%
● Based on whether or not they want to show someone else - 58%
● It’s something they want to post on social media - 38%
● Cuteness factor - 29%
● It’s something a friend or family member would like to see - 28%
● They want to add it to their photobook - 15%
Survey methodology:
This random double-opt-in survey of 2,000 general population Americans was commissioned by Mixbook between August 15 and August 16, 2023. It was conducted by market research company OnePoll, whose team members are members of the Market Research Society and have corporate membership to the American Association for Public Opinion Research (AAPOR) and the European Society for Opinion and Marketing Research (ESOMAR).
35
views

9 in 10 parents admit they’ll never stop worrying about their child’s wellbeing
Almost nine in 10 parents admit they’ll “never” be done worrying about their child.
According to a new survey of 2,000 parents of children ages 0-6, 89% agree that even when their child is grown and out of the house, they’ll never stop worrying about their wellbeing.
Two in five (43%) are concerned about their child every waking moment.
The top worries parents burden themselves with were found to be their child’s emotional well-being (45%), health (43%) and physical safety (38%).
When it comes to parenting style choices, many are concerned about technology use and screen time (43%). This was followed by their finances (41%), being a role model (38%) and work-personal life balance (34%).
But regardless of their own parental anxieties, it only took the average respondent five months to feel confident in their parenting abilities.
Conducted by OnePoll on behalf of Safety 1st, research revealed that over the last six months, parents have lost close to two full days of sleep (45 hours) worrying about their child — though 11% admit they’ve lost more than five full days — or over 120 hours.
Almost every parent (84%) had concerns about their baby before even bringing them home from the hospital. Those include how they are going to guide and teach them (48%), their own parenting abilities (47%) and even not having the right items (29%).
But almost two-thirds (63%) of parents felt prepared to address them and spoke to other parents (56%) or to their doctor or health care provider (50%).
Others practiced the tasks they were worried about ahead of time (41%) and baby-proofed their home (38%).
One-third of parents did the basics when it comes to child-proofing, but 26% left no stone unturned and took care of their entire home.
“It's clear that parents' commitment to the safety and wellbeing of their children is boundless and ever-present," says Kristen Ahern, Director Brand Marketing at Safety 1st. "The finding that 89% of parents never stop worrying, even when their child is grown, underscores the profound depth of parental love. It's important to find product solutions that help parents navigate these common anxieties, so families can focus on the joyous moments of raising their young ones.”
Parents are most concerned about their child’s safety in public places such as stores or restaurants (57%), followed by playgrounds and parks (42%), in daycare or at school (42%) and at events like concerts or sporting events (26%).
The survey also asked each respondent to share some tips and tricks they utilize to keep their kids safe. One parent said, “I write my contact information on the tags in their clothes.”
Another uses the tried and true method of hand holding, but with an added twist, “We both wear a friendship bracelet with a strap attaching them so they don't get lost or kidnapped.”
Of the 63% of parents who’ve traveled out of state or gone on vacation with their infant, 28% admit to packing too much.
The top things to bring on a trip with your child were found to be an infant car seat (37%), full-sized stroller (32%), thermometer (31%), booster car seat (28%) and a compact-sized stroller (25%).
"Traveling with children, especially the young ones, can be a unique challenge — every parent wants to ensure their child's comfort while maintaining safety,” said Ahern. “The survey highlights that, from deciding what essentials to pack to keeping kids entertained during the journey, parents truly go the extra mile.”
WHAT ARE THE HARDEST PARTS OF TRAVELING WITH YOUR CHILD?
● Finding ways to keep them entertained during the trip - 45%
● Making sure I had everything they needed - 45%
● Choosing which items to bring and which to leave at home - 29%
● Having the right amount of snacks/food - 27%
● Making sure my child doesn't get lost - 27%
● Ensuring safety at the destination - 26%
● Packing bulky items (car seat, strollers, etc.) - 21%
● Traveling to the destination - 21%
● Avoiding sickness - 19%
● Losing luggage with my child’s supplies - 8%
Survey methodology:
This random double-opt-in survey of 2,000 parents of children ages 0-6 was commissioned by Safety 1st between August 28 and Sept. 4, 2023. It was conducted by market research company OnePoll, whose team members are members of the Market Research Society and have corporate membership to the American Association for Public Opinion Research (AAPOR) and the European Society for Opinion and Marketing Research (ESOMAR).
46
views

Most unwanted gifts that people receive
The most unwanted gifts people receive are diet plans, cufflinks and soap on a string.
A poll of 2,000 adults found 75% receive up to seven presents each year which they’ll never use - with friends, children and colleagues labelled as the worst present givers.
Bad romance novels, hankies and aftershave were seen as other dull items to be gifted on birthdays, Christmas and beyond.
While 57% don’t welcome clothing of any kind being selected by someone else.
The research, commissioned by personalised book publishers, Wonderbly and conducted by OnePoll, found when reacting to an unwanted present, 27% graciously accept it while 17% pretend to be delighted.
However, a tenth show no emotion and simply ‘do nothing’ and 21% have even fallen out with a loved one over a terrible present.
Not wanting them to go to waste, 26% donate their disappointing gifts to charity while 14% adopt an ‘out of sight, out of mind’ mantra by hiding them in the house.
And while a shameful 18% rewrap and regift to someone else, 22% said they have previously experienced this themselves.
Of those who have ever been given their own gift, 32% ended up telling them but 31% decided to say nothing as they are too embarrassed.
“Giving and receiving gifts is one of life’s little joys,” said the brand’s spokesperson.
“There’s a great deal of emotion in gift giving, the perfect gift can leave someone speechless while the wrong one can cause feelings of disappointment.”
When watching someone open a present they clearly don’t want, 22% are filled with disappointment, while a quarter feel anxious and awkward the receiver is disappointed.
Nonetheless, 39% rate their gift giving skills as ‘pretty good’ with only 4% admitting they are ‘terrible’.
When it comes to great gifts, photobooks, gift vouchers and something which has been made by their children have been voted as some of the best.
Partners take the crown for the top gift givers followed by children and moms.
When receiving these types of presents, 21% experience pure happiness and a further 21% feel grateful.
The study also found 77% prefer something that feels like a lot of thought has gone into it - with 70% agreeing personalized gifts mean more to people.
Nearly four in 10 (39%) says these types of presents show that an extra level of effort has been made and 25% believes it provides an emotional connection.
“Giving gifts a little more thought really goes a long way to the person receiving it, but also to the person who gives it,” the spokesperson added.
“Choosing a present for a friend or loved one can be really rewarding and when you get it right, it’s often a gift that’s treasured forever.”
TOP 50 WORST GIFTS TO RECEIVE
- Bad romance novels
- Diet plan
- Car manual
- Soap on a string
- Children’s toys
- Cufflinks
- A tie
- Hankies
- Aftershave
- Movies you’ve already seen
- New map of the United States
- Cleaning products
- Joke books
- Address books
- New windscreen wipers
- Sports memorabilia
- De-icer
- Boxers or pants
- Mousepad
- Dressing gown
- Apron
- Party games
- A scarf
- Chocolate coins
- Calendars
- Bath salts /bubble bath
- Iron
- Anti-ageing products
- Potpourri
- Car maintenance kit
- One of those packs with beer or gin with a glass to drink it out of
- Crossword book
- Gym membership
- Hamper
- Chocolate fondue set
- Photo frames
- Hairdryer
- Knitwear
- Slogan t-shirts
- Novelty socks
- Perfume
- Lingerie
- Electric toothbrush
- A mug
- Stationary
- Bottle of booze
- Slippers
- Toiletry kits
- Electric blanket
- Foot spa
33
views

Research reveals why people say food is their love language
Seven in 10 (70%) people have pretended to enjoy a food or meal they didn’t like to avoid hurting someone’s feelings.
A survey of 2,000 U.S. adults found that regardless, nearly two-thirds (64%) say food is their love language.
About half (48%) show their loved ones they care by regularly surprising them with their favorite foods.
Those looking to express their affection through food can’t go wrong by preparing a homemade meal (64%), creating someone’s favorite snack trays (61%), buying their favorite candy (60%) or baking a homemade dessert (60%).
Conducted by OnePoll on behalf of Farm Rich, the survey also revealed people have bought or cooked a meal for someone to say “I Love You” (53%), console them (53%) and express thanks (51%).
The top recipients of these meals? Their partner/spouse (61%), children (58%), grandparents (47%) and friends (47%).
Among respondents who are parents, 67% bond with their child over a shared love for food.
Additionally, results discovered the most impressive foods to make from scratch.
Preparing or cooking a meal is more meaningful than buying one (25% vs. 13%), but which dishes are most effective?
The top meal to cook for a lasting impression is pizza (19%), while cheese/mozzarella sticks and meatballs were tied for the most impressive snacks or appetizers to make (14% each).
And if you want to indulge someone’s sweet tooth, you can’t go wrong with homemade ice cream (14%) or cupcakes (13%).
Going on a date? Cookies (48%), ice cream/milkshake (47%), pizza (46%) and cake (46%) are the most romantic meals to share with a partner — more so than oysters (24%).
We all know how being forgetful can be a relationship deal-breaker, but some things are more important to remember than others.
According to respondents, forgetting their favorite meal (32%) is a bigger taboo than failing to remember their favorite TV show or movie (27%).
“Food remains a timeless love language, transcending differences between people through the shared experience of enjoying a delicious meal or snack, and a fast way to find common ground,” said a spokesperson for Farm Rich.
More than two-thirds (67%) say sharing is caring when the item in question is their favorite food.
And 59% are likely to share their favorite meal with others.
But while 72% said they’re usually honest about their partner’s cooking skills, only half (53%) of those in relationships rated their partner’s cooking skills as “excellent” or “good.”
“No matter who cooks or prepares the meal, our research shows that when it comes to food, it’s the effort that counts and is remembered the most,” the spokesperson added.
PEOPLE’S DATE-DEFINING FOODS
● Cookies - 48%
● Ice cream or milkshake - 47%
● Pizza - 46%
● Cake - 46%
● French fries - 40%
● Wine and cheese - 39%
● Cheese sticks - 37%
● Sushi - 37%
● Taco/burrito - 28%
● Oysters - 24%
● Tapas - 19%
● Pasta - 18%
Survey methodology:
This random double-opt-in survey of 2,000 general population Americans was commissioned by Farm Rich between Aug. 14 and Aug. 16, 2023. It was conducted by market research company OnePoll, whose team members are members of the Market Research Society and have corporate membership to the American Association for Public Opinion Research (AAPOR) and the European Society for Opinion and Marketing Research (ESOMAR).
45
views

1 in 4 people of color with eczema feel ashamed
One in four people of color with eczema feel ashamed of others seeing their skin every day (26%), according to new research.
A survey of 1,500 people of color with eczema looked at their experiences of living with their skin condition.
While 72% said that other family members have eczema, one in nine shared that they don’t know anyone else who has the same condition.
Conducted by OnePoll for Aveeno, the survey found that half of respondents said that their eczema has had a negative impact on their life overall (49%).
Similarly, 30% think about how their eczema affects them every day, especially when it comes to doing certain activities or socializing.
Respondents find themselves avoiding activities that involve them spending time with others like visiting family or going to parties (30%).
One in five shared that their love life has also suffered, as they avoid dating because of their eczema (20%).
They also avoid making physical contact with others (29%).
Being active can be a challenge, too. Those surveyed avoid physical activities like swimming (30%), exercising or playing sports (20%) and walking or running for a long period of time (19%).
Thirty-seven percent of respondents shared that they feel insecure about their eczema every day.
Conscious clothing decisions are made every day to avoid options that expose areas where their eczema is visible (27%).
Respondents also keep a close eye on the weather and avoid going out when it’s overly warm or cold (38%), with some taking extra measures like wearing protective clothing to ensure eczema does not flare up (24%).
More than a quarter of those surveyed also avoid certain foods because of their eczema (28%).
To help combat flare-ups, 21% try to eat foods high in Omega-3.
But sometimes eating right just isn’t enough; 49% of people of color who have eczema struggle with their skin condition on a daily basis.
“Sensitive skin and eczema are skin conditions that can be managed with the right care,” said Sabrina R. Henry, chief principal scientist at Aveeno. “In addition to dermatologist visits, I recommend looking for topical products that have ingredients that soothe and nourish the skin, like oat. Oat naturally contains proteins, vitamins B and E, and nourishing lipids that work to lock in moisture for rough, dry skin and help maintain the balance of the skin’s microbiome for healthy looking skin.”
Thirty-six percent are wary of products that they may have a bad reaction to and another 37% admit that they don’t know what their skin needs.
Three in five attribute their sensitive skin to their eczema (61%); others noted skin issues like dry skin or psoriasis.
Respondents often moisturize frequently (53%) and only 38% bathe daily to help against skin flare or irritation.
If it weren’t for their eczema, respondents would love to spend more time socializing (34%).
“Everyone deserves to feel comfortable in their own skin,” said Henry. “Understandably, skin can have quite an impact on one’s esteem and quality of daily life. With the right care and topical products, those suffering from eczema and sensitive skin can help nourish their skin and boost their confidence.”
Survey methodology:
This random double-opt-in survey of 1,500 people of color who have eczema was commissioned by Aveeno between June 21 and August 9, 2023. It was conducted by market research company OnePoll, whose team members are members of the Market Research Society and have corporate membership to the American Association for Public Opinion Research (AAPOR) and the European Society for Opinion and Marketing Research (ESOMAR).
98
views

Majority of those with disabilities say their career options are limited
It’s all of us or none of us — a new survey has found a majority of Americans believe companies need to value accessibility.
The poll of 1,000 employed Americans and 1,000 employed Americans with disabilities found that 9 in 10 respondents overall said it was important for their employers to value diversity and inclusion, specifically including individuals with disabilities.
Highlighting the challenges Americans with disabilities face in the workplace, 57% of Americans with disabilities believe that their disability has limited their career opportunities.
Forty-three percent of all respondents believed that people with disabilities are not given equal opportunities for employment and advancement in the workplace.
In recognition of National Disability Employment Awareness Month (NDEAM) this October, the study conducted by OnePoll and commissioned by SourceAmerica was designed to highlight the crucial need for more public and private sector help in creating additional job opportunities for people with disabilities.
“The survey results strengthen our resolve to create access to more jobs for people with disabilities in the workforce. Our goal is to create a level playing field where anyone with a disability who wants to work has the opportunity to do so,” said Richard Belden, president and CEO of SourceAmerica. “As we approach National Disability Employment Awareness Month, we want to encourage employers nationwide to join us in connecting people with disabilities to competitive jobs with good wages and advancement potential to build careers.”
A majority (59%) of those with disabilities said they’ve left their job due to discriminatory acts, while only 26% of people without disabilities have made the same decision based on discrimination.
Two-thirds (68%) with disabilities said they’ve witnessed discrimination against someone with a disability in their workplace, twice as many (32%) as respondents without disabilities.
Fifty-eight percent of those with disabilities said they experienced workplace-related discrimination as early as during the job interview, compared to only 26% of Americans without disabilities.
The survey findings also revealed a lack of awareness about Diversity, Equity, Inclusion, and Accessibility (DEIA) initiatives, with six in 10 respondents indicating that they have not heard of DEIA.
Nearly half of respondents (48%) knew that the A in DEIA stood for Accessibility.
Of those familiar with DEIA initiatives, 58% believed that their employer is not doing enough to promote diversity and inclusivity. Seven in 10 believed more emphasis should be placed on people with disabilities in workplace DEIA initiatives.
Additionally, 67% viewed DEIA initiatives as essential for helping individuals facing barriers to employment, which includes people with disabilities.
Almost all respondents (93%) agreed that the government and private/public sectors should actively support employment opportunities for individuals with disabilities.
More than a third (37%) would like to see the government help employers set targets, quotas or goals for disability representation within their workforce.
“With this finding in mind, we continue to voice our support and educate lawmakers on the Congressional efforts to establish a 1% federal contracting goal for the AbilityOne Program,” added Belden. “Through this survey, American employees with and without disabilities across the country have made their voices heard and the results prove their desire for immediate action by lawmakers to provide more opportunities for employment for the disability community.”
ACTIONS EMPLOYERS CAN TAKE TO PROMOTE INCLUSIVITY FOR INDIVIDUALS WITH DISABILITIES
● Create flexible work arrangements and job modifications - 45 %
● Provide reasonable accommodations - 39 %
● Educate employees about disability inclusion and sensitivity training - 39 %
● Ensure equal access to training and development opportunities - 36 %
● Increase representation of individuals with disabilities in leadership - 32 %
● Foster a supportive and inclusive work culture - 29 %
● Implement inclusive hiring practices - 25 %
MEASURES GOVERNMENT CAN TAKE TO PROMOTE EMPLOYMENT OPPORTUNITIES FOR PEOPLE WITH DISABILITIES
● Ensuring that workplaces are equipped with the necessary accommodations - 57 %
● Conducting disability awareness training for hiring managers and employees - 49 %
● Collaborating with disability-focused organizations - 40 %
● Setting targets, quotas, or goals for disability representation within their workforce - 37%
● Sharing success stories of individuals with disabilities - 34 %
DISCRIMINATIVE ACTS PEOPLE WITH DISABILITIES HAVE FACED IN A WORKPLACE
● Negative attitudes impacting work relationships - 38 %
● Inappropriate comments or jokes about my disability -37 %
● Assigned lower-quality tasks due to my disability - 35 %
● Unequal growth or advancement opportunities - 33 %
● Withheld information or resources - 30 %
● Exclusion or isolation from work activities - 29 %
● Ignored contributions based on my disability - 27 %
Survey methodology:
This random double-opt-in survey of 1,000 employed Americans and 1,000 employed Americans with disabilities was commissioned by SourceAmerica between July 14 and July 21, 2023. It was conducted by market research company OnePoll, whose team members are members of the Market Research Society and have corporate membership to the American Association for Public Opinion Research (AAPOR) and the European Society for Opinion and Marketing Research (ESOMAR).
73
views

Survey reveals how Americans are redefining self-care
Forget once-a-month bubble baths—instead, new research shines a light on smaller daily acts of self-care.
A survey of 2,000 nationally representative Americans found more than half (52%) agree that “self-care days” are only temporary fixes compared to practicing smaller daily habits.
When it comes to what self-care is, 64% of U.S. adults think of it holistically, as balancing all aspects of health or creating habits that contribute to overall well-being.
While eight in 10 respondents say practicing daily self-care habits is a priority, many (41%) have let them falter over the past year.
And more than two in five (44%) believe it is difficult to balance all aspects of their health.
One-quarter of all respondents (24%) even claimed they don’t have time for self-care on a regular basis.
Those struggling to prioritize self-care cite being too preoccupied with household chores and responsibilities (56%) caring for their family (49%) and work (47%).
Mothers in particular are having an even harder time, with 50% of those surveyed agreeing that, over the past year, they have let their self-care habits fall behind.
The survey, commissioned by Medifast, health and wellness company behind the habit-based and coach-guided program OPTAVIA, also found that three out of five U.S. adults said it’s important to have support from others when it comes to prioritizing self-care (63%).
“Consumers today have an abundance of information and options contrasted by little time and lack of support. People need simple yet comprehensive solutions that help them make a healthy lifestyle second nature, whether they are struggling to manage their weight or find time for healthy motion,” said Dan Chard, chairman and CEO of Medifast. “Approaches that are scientifically designed, backed by experts and offer the support of a community will resonate as people continue to seek out realistic ways to prioritize their health and wellbeing.”
Yet, life happens. Respondents said they were likely to acknowledge a need for more “self-care” time when feeling overwhelmed (41%), tired for an extended period of time (39%) or easily irritable (38%).
They feel forced to prioritize self-care when recovering from an illness (34%) or facing financial hardship (25%).
And it isn’t just major events, others prioritize self-care more when facing pressure at work (20%), after a romantic relationship change (19%) or even after a disagreement with a loved one (18%).
Overall, 36% of those surveyed are making it a top or high priority to practice self-care every day, like staying hydrated (48%), having a positive mindset (46%), going outside (43%) and getting quality sleep (36%).
Respondents also cited areas in which they need the most care, including exercise (33%), sleep (28%) and their mental and emotional health (27%).
While most (61%) acknowledge that it’s okay to misstep when trying to create healthy habits, like having an unhealthy snack or skipping exercise for a day, 35% said they’d feel discouraged or ultimately give up if they fell off track.
“In a fast-paced world, many expect instant gratification and are focused on quick fixes, which leaves them feeling discouraged when they don’t experience immediate results,” said Satya Jonnalagadda, Ph.D., MBA, RDN, vice president of scientific and clinical affairs at Medifast. “Staying persistent and motivated can be difficult, so it’s not surprising that people tend to be more successful in reaching their health goals when they have the support of a coach and community.”
Survey methodology:
This random double-opt-in survey of 2,000 nationally representative U.S. adults was commissioned by Medifast between March 31 and April 6, 2023. It was conducted by market research company OnePoll, whose team members are members of the Market Research Society and have corporate membership to the American Association for Public Opinion Research (AAPOR) and the European Society for Opinion and Marketing Research (ESOMAR).
57
views