Analysis BTC & Crypto market of November, 3, 2 P.M. Italian Hour
Crypto Market in the Red? Three Hidden Signs Everyone Is IgnoringIntroduction: Navigating the Noise of the Crypto MarketOpening your wallet and seeing a sea of red numbers can cause confusion and uncertainty. It's a common feeling in the volatile world of cryptocurrencies, where short-term panic often obscures long-term trends. But what if, hidden behind that noise, there were clear signals pointing in a different direction?This article aims to look beyond superficial price movements to uncover three key signals that emerged from a recent analysis by Valerio Rossi of VR Finanzas Smart Education School. Rossi's approach is not based on opinion, but on “technical, analytical, and mathematical considerations.” These insights will help you interpret the current market phase through three complementary lenses: market sentiment, Bitcoin's structural strength, and confirmation from traditional markets.First Signal: Fear is an Opportunity, not a ThreatThe Time to Buy is When Others are AfraidThe concept may seem counterintuitive, but moments of greatest fear in the market are often the best times to act. With Bitcoin hovering around $107,700, down from a recent high of $111,000, many investors see only a downturn.
An experienced analyst, on the other hand, sees a discount. This sentiment is confirmed by the Fear & Greed Index, an indicator that measures market sentiment and currently stands at 36. According to Rossi's rule, any value below 40 indicates a good time for conservative, long-term trading. But the analysis goes beyond sentiment, adding a technical justification: indicators such as the MACD show signs of a potential exhaustion of the bearish momentum. When asked directly by his audience—looking at the technical indicators, would you buy or sell?—his answer is clear: "My answer is very simple. I would buy if I had the funds available because it is the ideal situation in the short term and, of course, to be able to buy at a significantly lower price...“ The analysis becomes even more concrete, identifying an operating price range: ”in this price range from 106.500 to 108, it may be interesting to take a position." Changing one's mindset from “fear of decline” to “search for opportunity” is a crucial step for anyone who wants to invest with a long-term vision. Second Signal: Bitcoin's Hidden Strength Compared to the Market Bitcoin's “Slowness” is its True Strength In a sideways market,
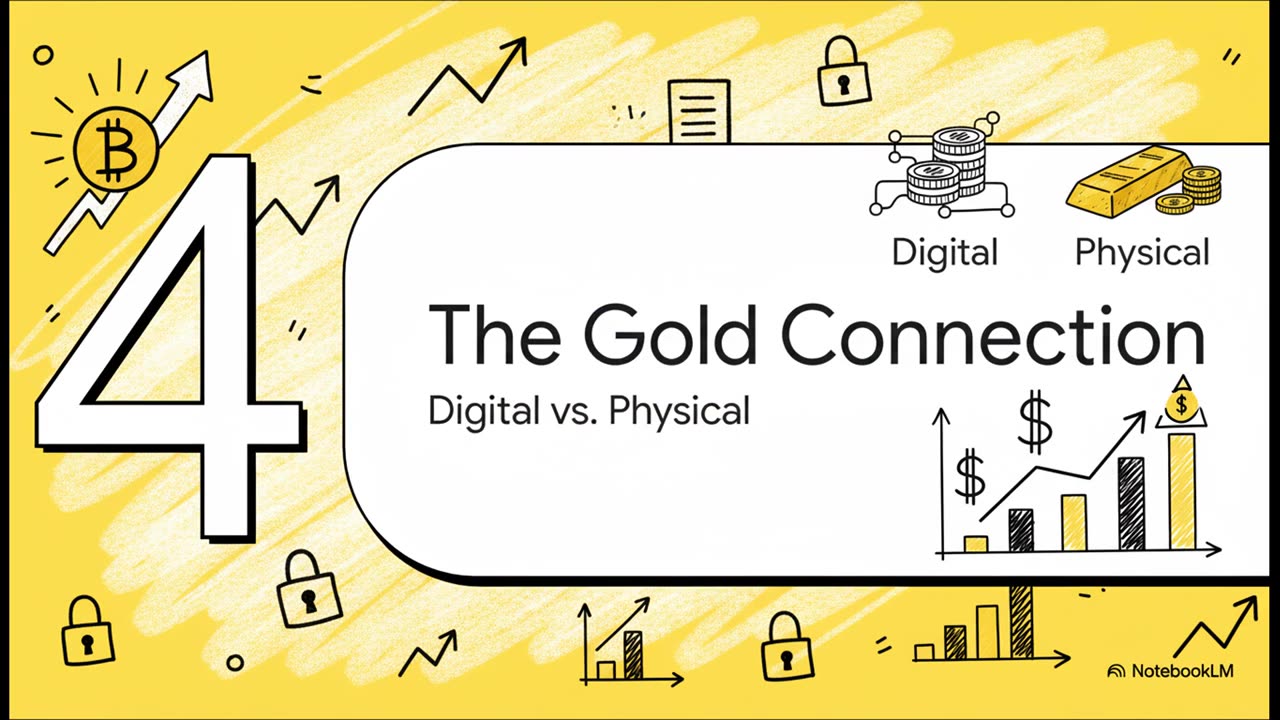
In a sideways market phase, awaiting cues from the US market opening, Bitcoin's relative stability becomes a powerful signal. While Bitcoin is down fractionally (-2.74% in 24 hours, -6.5% on a weekly basis), a broader view reveals that many other cryptocurrencies are suffering losses “roughly double” that. This discrepancy is not a sign of weakness for Bitcoin, but of its relative strength. Its “conservative” nature within a hyper-volatile sector makes it a pillar. This solidity is backed up by the numbers: with a market capitalization of $2.148 trillion, Bitcoin clearly dominates the second-ranked asset, Ethereum, demonstrating a position and investor confidence that are substantially different. This relative “stability” is what makes Bitcoin a key asset in a diversified portfolio. Its ability to better withstand market storms is a sign of maturity that should not be underestimated, especially in times of waiting and uncertainty such as the present. Third Signal: Physical Gold Confirms the Digital Gold Trend The Numbers Speak for Themselves: Don't Ignore the Signals from Physical Gold Often referred to as “digital gold,” Bitcoin shows interesting correlations with its physical namesake. For this reason, a comprehensive analysis cannot ignore what is happening in the commodities market. Currently, gold futures have stabilized above the key psychological level of 4,000, settling at standing at 4,026. The significance of this threshold is not accidental: below 4,000, institutional investors tend to believe that the price could fall much further; above it, however, this level acts as a “good basis for further extension.” The fact that gold is maintaining this position indicates positive sentiment and a certain determination against downward pressure. Ignoring these cross-market data means having a partial view. As Rossi points out, the approach must be guided by facts. “...as I always like to say, the numbers speak for themselves. These are the numbers, folks, the rest is just opinion...” Looking at analytical, mathematical, and cross-market data allows you to build a strategy based on solid foundations, rather than on the emotions of the moment.
-
 2:11:15
megimu32
5 hours agoOFF THE SUBJECT: Judging Strangers on Reddit 😭 PLUS! Fortnite Chaos!
36.8K7 -
 2:53:16
Mally_Mouse
3 days ago🎮 Throwback Thursday! Let's Play: Stardew Valley pt. 32
41.1K1 -
 28:25
28:25
ThisIsDeLaCruz
14 hours ago $3.88 earnedInside the Sphere Part 2: Kenny Chesney’s Vegas Stage Revealed
19.8K1 -
 LIVE
LIVE
Lofi Girl
2 years agoSynthwave Radio 🌌 - beats to chill/game to
191 watching -
 7:22:36
SilverFox
1 day ago🔴LIVE - ARC Raiders HUGE UPDATE - NEW MAP w/ Fragniac
14.6K1 -
 2:11:25
Nikko Ortiz
7 hours agoLATE NIGHT GAMING... | Rumble LIVE
95.6K7 -
 9:30:12
Dr Disrespect
15 hours ago🔴LIVE - DR DISRESPECT - ARC RAIDERS - NORTH LINE UPDATE
133K9 -
 3:02:44
PNW_Guerrilla
7 hours agoHalo CE
9.3K -
 1:01:11
Donald Trump Jr.
12 hours agoThe China Matrix with Journalist Lee Smith | TRIGGERED Ep.291
99.5K87 -
 2:59:34
XDDX_HiTower
5 hours ago $0.52 earnedARC RAIDERS, FIRST DROP IN
6.77K