Premium Only Content

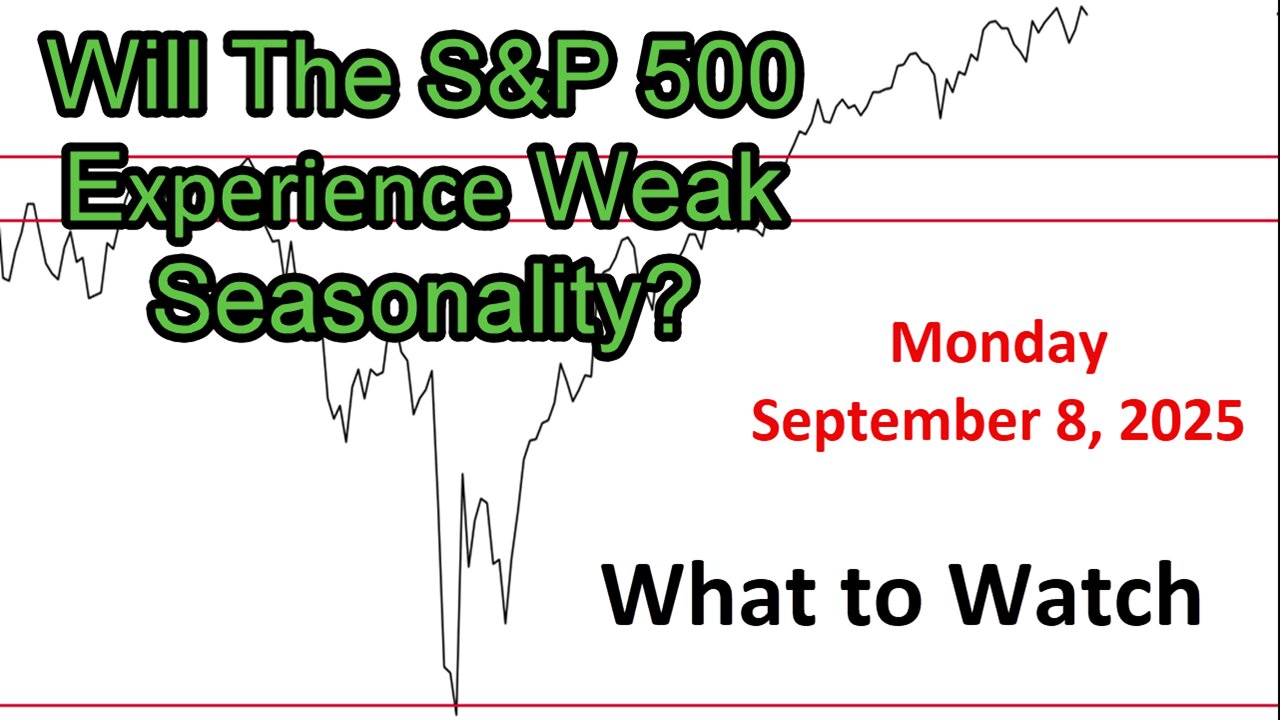
What to Watch for Monday September 8, 2025
Link to The SPX Investing Program https://spxinvesting.substack.com
Link to The Daily Pivot Newsletter: https://thedailypivotnewsletter.substack.com/
Link to Video-Only Immediate Access:
https://spxvideos.substack.com/
Summary of What to Watch Video Update (Prepared for Monday, September 8, 2025)
Overview:
The video analyzes current market trends using charts, categorized into positive, negative, and watchlist indicators, with a focus on whether the S&P 500 will experience weak seasonality in September, historically the worst month for markets. The markets anticipate a Federal Reserve rate cut (likely 25 basis points) reinforced by the weak employment report on Friday, raising questions about whether the cut is for fine-tuning or stimulating a weakening economy. Key upcoming economic reports, including PPI (Producer Price Index) and CPI (Consumer Price Index), are expected to influence market sentiment this week.
Key Points:
1. Market Context:
Despite historical post-election year August declines, August 2025 was positive (+1.91%).
September’s weak seasonality is under scrutiny, with markets buzzing about an expected Fed rate cut.
The weak employment report has sparked debate: is the economy slowing too much, or is it stable enough for a minor rate adjustment?
2. Positive Indicators:
S&P 500 Performance: Up slightly (+0.33%) in a shortened week, closing above the key 6468 weekly pivot point, breaking above long-term resistance.
Intraday Charts: Growth and value charts show improvement, with the S&P above moving averages.
Sector Strength: Large-cap growth hit an intraday all-time high; discretionary equal weight and staples ratios look positive.
Market Breadth: Advance-decline lines (price and volume) are above moving averages, with NYSE common stock volume breaking out to a new high.
Smart Money Indicators: Accumulation distribution, Chaikin Money Flow & Oscillator, and Vortex indicators are positive, though some show high readings, suggesting caution.
Trends: Short- and intermediate-term trends remain positive, with the S&P above key moving averages (20, 50, 100, 200 periods).
Other Markets: Small caps (S&P 600, Russell 2000) and mid-caps show breakout potential, benefiting from expected rate cuts. Financials and regional banks are in uptrends, and the FANG index (driven by Google and Apple) hit an all-time high.
Bond Ratios: Stock-to-bond ratios (e.g., S&P to 3-7 year bonds) indicate a soft landing, not a recession.
3. Negative Indicators:
Sentiment: Fear and Greed Index is declining, even on up days, signaling apprehension.
Growth vs. Value Ratios: Ratios such as the S&P growth-to-value, small-cap growth-to-value, and mid-cap growth-to-value are below moving averages, showing defensive market behavior.
Momentum: Short-, intermediate-, and long-term momentum oscillators (e.g., Coppock Curve, Bullish Percent Index) are negative or declining.
McClellan Oscillator: Negative for the S&P, indicating a lack of conviction.
Zahorchak Method: A long-term broad market measure dropped to -6 (from 0), signaling weakness.
4. Watchlist Indicators:
Employment Data: Weekly jobless claims are up but range-bound; continuing claims are in a higher range, and the unemployment rate rose to 4.3%.
Volatility (SKU Index): High levels suggest an impending big market move, direction unclear.
Risk Ratios: Risk-on to risk-off and high-beta to low-beta ratios lack conviction.
Bonds and Yields: Junk bonds are underperforming government bonds, and the 10-year Treasury yield is declining, potentially oversold. Lower yields are positive but could signal economic concerns if they drop too far.
Inflation Concerns: Cash-to-bond and TIPS-to-bond ratios are range-bound, showing no strong inflation fears.
Sectors and Ratios: Retail shows improvement, while semiconductors lag. Gold-to-S&P ratio is rising due to gold’s breakout. U.S. stocks are improving relative to German stocks.
Conclusion:
Stocks have positive technicals (e.g., S&P above key levels, small-cap strength) tempered by negative signals (e.g., declining momentum, defensive growth-to-value ratios). The expected Fed rate cut and upcoming PPI/CPI reports will be critical in determining whether September follows its weak historical trend or defies expectations.
PDF of Slides:
https://drive.google.com/file/d/1z8I2ZqDFc412db3pCJpESarWZNanKZzM/view?usp=sharing
DISCLAIMER This video is for entertainment purposes only. I am not a financial adviser, and you should do your own research and go through your own thought process before investing in a position. Trading is risky!
-
 41:57
41:57
The SPX Investing Program
20 hours agoS&P 500 Daily Update for Tuesday November 11, 2025
21 -
 LIVE
LIVE
LFA TV
15 hours agoLIVE & BREAKING NEWS! | WEDNESDAY 11/12/25
4,351 watching -
 18:53
18:53
Professor Nez
1 hour agoDemocrats TURN on Chuck Schumer & BOOT HIM OUT of the Party!
7.31K4 -
 LIVE
LIVE
The Mel K Show
1 hour agoMORNINGS WITH MEL K - Dueling Narratives & Endless Distraction: Don’t Lose Focus! - 11-12-25
700 watching -
 LIVE
LIVE
The Shannon Joy Show
1 hour agoH1-B-Trayal! How Many Times Does Trump Have To Punch MAGA In The Face Before They Realize He’s Just Not That Into Them?
220 watching -
 1:56:53
Badlands Media
10 hours agoBadlands Daily: November 12, 2025
90.1K9 -
 43:54
43:54
VINCE
3 hours agoThomas Speciale: The Man Behind John Brennan's Meltdown | Episode 167 - 11/12/25 VINCE
73.4K109 -
 LIVE
LIVE
Nikko Ortiz
2 hours agoMILITARY FAILS AND KAREN ACTIVITIES... |Rumble Live
229 watching -
 2:59:36
Wendy Bell Radio
8 hours agoMAGA's Wake Up Call
65.2K153 -
 22:16
22:16
iCkEdMeL
2 hours ago $1.07 earnedBREAKING: Road Rage Shooting Reported on San Antonio’s East Side | LIVE Scene
16K1