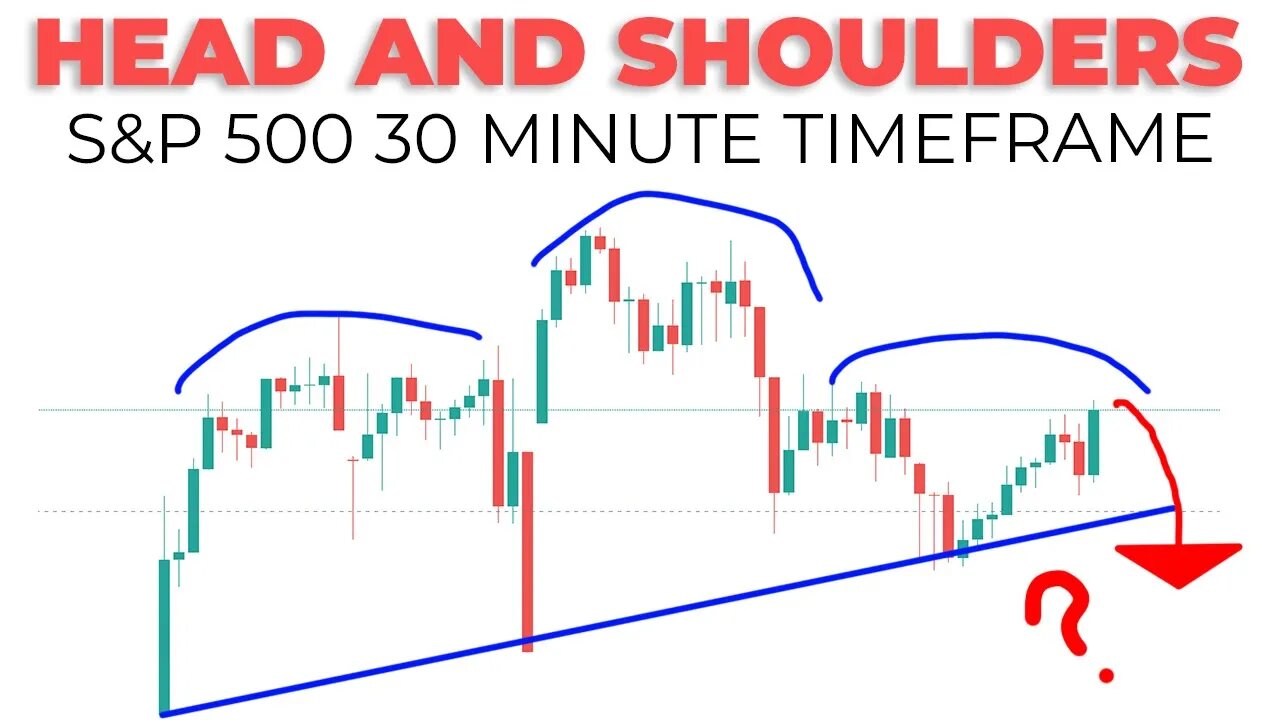
S&P 500 Technical Analysis: Head And Shoulders Chart Pattern Forming
In today's S&P 500 Technical analysis I discuss the head and shoulders chart pattern forming on the 30 minute time frame. First I will go over the weekly timeframe , then daily, and then the 30 minute timeframe where this pattern is forming.
Head and shoulders patterns are typically bearish once the neck line is broken. Keep an eye on the s500 for a potential crash through the neck line when the market opens after memorial day weekend.
★ GET 2 FREE STOCKS by using Webull: https://bit.ly/37wobNT
★☆★ Subscribe★☆★
https://bit.ly/2SfhnxO
Connect With Me:
Instagram ▶️: https://www.instagram.com/figuringoutmoney
Twitter ▶️: https://twitter.com/mikepsilva
#SP500 #TechnicalAnalysis
DISCLOSURE: I am not a professional investment advisor, nor do I claim to be. All my videos are for entertainment and educational purposes only
-
 23:55
23:55
Figuring Out Money
1 year agoWeird Things Are Happening Right Now
60 -
 1:25:56
Graham Allen
3 hours agoThis Is How We Win The Midterms!!! No More Games….WIN OR WE LOSE EVERYTHING!
93K1.66K -
 LIVE
LIVE
LadyDesireeMusic
1 hour agoLive Piano Music & Convo - Make Ladies Great Again
220 watching -
 LIVE
LIVE
Badlands Media
6 hours agoBadlands Daily: November 14, 2025
3,503 watching -
 2:07:06
Matt Kohrs
14 hours agoStocks Crash, Crypto Plummet & Payday Friday || Live Trading Options & Futures
9.31K2 -
 LIVE
LIVE
Caleb Hammer
57 minutes agoThe Most Racist Woman On Financial Audit
127 watching -
 LIVE
LIVE
Viss
1 hour ago🔴LIVE - Arc Raiders The Game Of The Year!
137 watching -
 LIVE
LIVE
The Big Mig™
1 hour agoRep Eric Swalwell On The Hit List, Indictment Imminent
2,844 watching -
 1:10:14
Chad Prather
18 hours agoFinding Unity, Power, and Purpose in the Midst of Cultural Chaos
79.3K42 -
 20:00
20:00
Bearing
4 hours agoTHEY’RE GENOC1DING THE FATTIES 🍔💀
4.8K14