


Why IT workers aren’t afraid of AI
Over half of IT workers feel overwhelmed by the amount of tasks they have to do in a day.
The international poll of 1,000 U.S.-based, 250 U.K.-based and 250 India-based IT decision-makers found 58% overall feel overwhelmed — 78% in India, 60% in the U.K. and 53% in the U.S.
On any given day, the average IT worker only has the capacity to support 85% of the tickets they receive. And while roughly half are easy for IT teams (50% in the US, 48% in the UK, and 46% in India), nearly one-third (29%) of tickets are considered difficult to resolve.
IT workers also reported they are frequently responsible for a range of additional tasks within their organization, which may contribute to feeling overwhelmed.
Respondents said they are responsible for addressing cybersecurity issues (39%), internal security issues (26%), and lack of budget (25%).
But, according to the study commissioned by GoTo and conducted by OnePoll, AI (artificial intelligence) is increasingly coming to the rescue of IT teams and is likely to continue evolving the way they work in the years ahead.
A large majority of respondents (92%) would consider the use of AI beneficial for work and 94% say they would be willing to delegate simple tasks to AI. Seventy-three percent would also be willing to delegate even complex tasks to the technology.
On average, IT workers believe delegating tasks to AI could save them more than two hours of work during any given workday.
Four in five (83%) believe it would be easy for them to offload their simpler tasks to AI. In fact, the potential of AI has caused 93% of IT leaders to consider upskilling in order to leverage the technology in their day-to-day tasks.
The most commonly reported tasks IT teams are looking to offload to AI included monitoring network performance (44%), basic device troubleshooting (42%) and remediating basic problems (40%).
“Despite many feeling overwhelmed, we’re excited to see how IT decision-makers are seeing AI as a beneficial tool that they can use to make IT easier to manage,” said Olga Lagunova, Chief Product and Technology Officer at GoTo. “Many people see AI as this scary entity, capable of taking their jobs. But what this data tells us is that there are many people in this industry across the globe who see it as a way to make their own workloads easier.”
The survey also revealed 73% of IT teams already use AI, and 61% of those who don’t are planning to adopt it in their organization within the next 12 months. Sixty-five percent said their team is directly responsible in deciding if their organization will use AI in the future.
In adopting AI, many shared how they believe their roles will be affected over the next 10 years: having more time to focus on higher-priority tasks (48%), more efficient ticketing workflows (43%), and additional IT team responsibilities (41%).
If AI were able to manage certain tasks on their behalf, respondents would spend more time working on improving their organization’s IT infrastructure (55%), focus on more difficult tickets (46%), or improve their organization’s security (42%).
In the US, 44% would aim to improve their organization’s security. Meanwhile, many in India (48%) and in the UK (36%) would take the time to focus on their professional development.
“There’s no denying that there’s still a lot for us to learn about AI and what it can do,” continued Olga Lagunova. “What’s important to keep in mind is how people in the IT industry are keeping themselves properly up to date and informed on the best practices of AI in their workflow. And we believe that it’s going well.”
Survey methodology:
This random double-opt-in survey of 1,000 U.S.-based IT decision makers, 250 U.K.-based IT decision makers, and 250 India-based IT decision makers was commissioned by GoTo between Feb. 28 and Mar. 8, 2024. It was conducted by market research company OnePoll, whose team members are members of the Market Research Society and have corporate membership to the American Association for Public Opinion Research (AAPOR) and the European Society for Opinion and Marketing Research (ESOMAR).
23
views

One-fifth of Americans think about next vacation while on vacation
One in five Americans are “always” thinking about planning their next vacation while on vacation, according to new research.
A survey of 2,000 adults who travel found that one in five long to be on vacation again the day they get back (21%) and another 27% said this feeling sets in within a week.
The average person spent 11 days on vacation in 2023.
Looking ahead, the average American wants to spend 15 days on vacation in 2024 and, if they had unlimited PTO, they’d want to spend 18 days.
Although just a quarter of respondents said they travel more than the average person they know, 46% want to be known as a frequent traveler by others in their life.
Conducted by OnePoll for timeshare brand Club Wyndham, the survey found that 89% of those surveyed said vacation reduces their stress levels, even temporarily, with 84% saying a vacation can relax them and decrease stress for up to two whole weeks upon returning.
A majority of respondents said that they consider vacations as a form of self-care (86%).
Similarly, eight in 10 would be interested in a “do-nothing” vacation where they sit by the pool, beach or inside reading a book or relaxing.
“According to the survey, more than 70% of potential travelers count down to their vacation, and a majority long to travel again just one week after returning home,” said Annie Roberts, senior vice president of club and owner services at Club Wyndham.
“With today’s travelers often putting a great deal of time and thought into the trip planning and dreaming stages to ensure a vacation that is well tailored to their interests, it’s not surprising that they want to experience the ‘vacation glow’ again and again.”
To make sure they get what they’re looking for, those surveyed go to great lengths to plan their vacations.
Respondents want to steer clear of discomforts like sharing a bathroom with others (27%) and want to avoid situations where they would have difficulty sleeping (27%).
Nearly a quarter of travelers said sharing a hotel room isn’t ideal and the same percentage said small hotel rooms were a dealbreaker (23%, each).
Most Americans surveyed said that when on vacation with others, they prefer having their own or extra space to spread out (79%), including 82% of parents.
If they had their dream hotel room, respondents would make sure there was Wi-Fi (55%), a private balcony or outdoor area (41%), a large bedroom (37%), a large bathroom (33%) and a full-sized kitchen or kitchenette (32%).
“With nearly a third of respondents (29%) spending most or all their time at their hotel or resort while on vacation, it’s clear that travelers deserve more than just a place to sleep,” said Roberts. “People want to ensure their vacation decisions bring them quality, consistency and peace of mind for their entire experience. Accommodations that actually enhance your vacation, like separate bedrooms, bathrooms and full-sized kitchens, offer travelers a special luxury — the chance to gather comfortably to enjoy shared moments that become lifelong memories.”
Survey methodology:
This random double-opt-in survey of 2,000 Americans who travel was commissioned by Club Wyndham between March 22 and March 28, 2024. It was conducted by market research company OnePoll, whose team members are members of the Market Research Society and have corporate membership to the American Association for Public Opinion Research (AAPOR) and the European Society for Opinion and Marketing Research (ESOMAR).
25
views

How hard is it for Americans to live sustainably?
A new survey found that one in six Americans admit they’re not well-informed about the ingredients in their commonly used products, with Gen Z feeling the least informed (19%).
The poll of 2,000 Americans, which looked at their efforts to be sustainable in their everyday lives, found that it’s harder than it may seem. More than half of respondents believe it’s “near impossible” to live guilt-free in their homes when it comes to sustainability (57%).
Forty percent of those surveyed consider their lifestyle “somewhat environmentally friendly,” while 28% said they are living a “very environmentally friendly” lifestyle, especially millennials (42%).
Part of living sustainably, according to 73% of those surveyed, is the importance of knowing the ingredients in the products you use often.
Millennials (79%) and baby boomers (65%) are particularly keen on understanding what’s in their products, and thus in their homes.
Yet, the survey conducted by OnePoll for Seventh Generation found that just 14% of all Americans surveyed said that sustainability is a priority when shopping around.
Of all the different items that they use to care for their home, respondents narrowed the absolute necessities down to trash bags (70%), dish soap (67%) and laundry detergent (65%).
However, the survey found that a quarter of Americans haven’t considered the impact these products have on the environment.
Respondents weren’t aware that common household items may contain fossil fuels like toothpaste (39%), which contains poloxamer 407 a petroleum derivative that helps make oil-based products dissolve easier in water.
Thirty-five percent of those surveyed didn’t know plastic dishes were composed of refined natural gas and oil (35%), and 26% weren’t aware that laundry detergent contains chemicals created from petroleum.
They were most surprised to discover toothpaste (51%) contains these materials, while another 36% were surprised to learn this about laundry detergent and 32% didn't expect candles to contain these kinds of traces.
“Many consumers don’t realize that many ingredients in conventional household products are petroleum-based,” said Alison Whritenour, CEO of Seventh Generation.
“Green chemistry has come so far and it’s completely possible to make plant-based products that will clean like conventional products. Choosing plant-based products is one simple way people can lessen their impact on the environment without sacrifice.”
Nearly half of Americans said that it shouldn’t fall on consumers to worry about the safety of the products they purchase (48%).
In fact, nearly four times the number of respondents believe that brands are more responsible for product safety as opposed to consumers (45% vs. 12%).
Similarly, 42% believe that consumers should be able to expect environmental friendliness when making purchases without having to do extensive research.
While 45% aren’t sure that it’s possible to avoid fossil fuels completely within their home, two in three want to try to live more sustainably.
To get there, six in 10 want to eliminate unsustainable products from their home.
Fifty-five percent of respondents would switch the products they use to live a 100% environmentally friendly lifestyle, with 45% expressing their willingness to pay more for sustainable products.
Some would go to further extremes, saying they would only watch TV using one streaming platform (23%) or only drink water forever (18%) if it meant they’d be living more sustainably.
The top product Americans would have a hard time giving up, even knowing it can be unsustainable, is laundry detergent (19%).
“Americans don’t have to give up their favorite common household products to live more sustainably,” said Whritenour. “There are plant-based brands that are labeled USDA Certified Biobased with a wide variety of household cleaning and personal care products that provide effective alternatives for consumers to use every day.”
Survey methodology:
This random double-opt-in survey of 2,000 general population Americans was commissioned by Seventh Generation between August 16 and August 21, 2023. It was conducted by market research company OnePoll, whose team members are members of the Market Research Society and have corporate membership to the American Association for Public Opinion Research (AAPOR) and the European Society for Opinion and Marketing Research (ESOMAR).
35
views
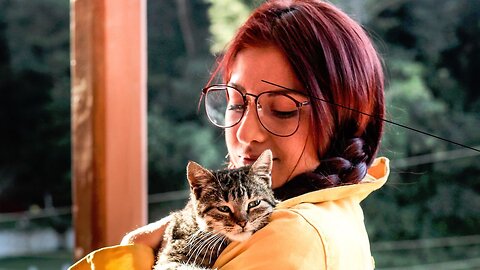
Most cat owners know very little about their feline friends
According to new research, cat owners still have a lot to learn when it comes to knowing all about their cat counterparts.
Even though nearly all cat owners (92%) believe they’re knowledgeable about cats, as part of a recent poll of 2,000 American cat owners, most don’t know basic facts about their feline — or its health needs.
Cat parents, on average, gave themselves a four out of five rating for how well they take care of their cat and reported they believe their cats would also give them a four out of five for being superb owners.
Yet, within the survey, cat parents confessed that, on average, they forget to fill up their cat’s water twice per week and even forget to feed their cats three times per week.
Commissioned by PetSafe and conducted by OnePoll, the study found that only 17% of respondents knew that cats have 18 toes and almost half (46%) didn’t know that many cats are lactose intolerant — debunking the popular image of a cat enjoying a bowl of milk.
The majority (56%) were unaware that cats purr due to both pleasure and distress and only a fifth (20%) knew that cats share 96% of their DNA with tigers.
The survey also found knowledge gaps on the more serious topic of hydration: More than four in ten (47%) didn’t know that cats tend to drink more water if it’s running and not still or stagnant.
And more than three-quarters (86%) also reported that their cats are sufficiently hydrated on a regular basis, yet three in four (75%) didn’t know that cats should drink roughly one ounce of water for every pound they weigh, per day.
The poll found that although six in ten cat parents (59%) admit they believe it’s healthier for their felines to drink filtered water versus unfiltered water, only 34% follow through and give their cats filtered water on the regular.
“By how well cat parents score themselves in terms of pet parenthood, it is obvious how much owners love their furry friends — there’s no doubt about it. The research found that seven in ten (69%) even said they can tell what their cat is thinking, even if they can’t communicate using words. But it also revealed some room for improvement in knowing about cats, so we can better take care of these furry companions,” said Janna Chollet, senior marketing manager at PetSafe. “With warmer months approaching, it’s important that cat parents have all the information they need to care for their cats, especially when it comes to hydration.”
Four out of five cat owners (79%) said their cats drink most of their water out of a bowl, 23% reported their cats mostly use a fountain to stay hydrated, and for cat parents who chose a bowl over a fountain, reasons for doing so included that it’s what their cat is used to (47%), it’s easy to fill up (44%) and it’s easy to clean (37%).
And even though 47% of all surveyed didn’t know that cats tend to drink more water if it’s running, almost seven in ten cat parents whose cats use a water bowl (68%) said they’d be likely to choose a fountain as their cat’s water source in the future if it could be proven that cats drink more water if it’s running and not still or stagnant.
For parents that prefer for their cats to drink out of a fountain, the top reasons for doing so was that their cat is attracted to running water (52%), the water is cleaner, fresher and healthier for their cat (43%) and they have more peace of mind knowing their cat has clean water (40%).
Cat parents who opt for a fountain said the most frustrating parts about cat fountains are being concerned it will stop working while they’re out of the house (31%), the amount of cleaning required (29%), expensive replacement filters (27%) and scrubbing mold out of the fountain (27%).
“Because cats add so much love to our lives and are mostly dependent on us, as owners, to meet their needs, we need to do our very best to take excellent care of them,” said Chollet. “Staying hydrated is the foundation of health so we encourage cat parents to choose a hydration solution that provides enough fresh, clean, running water for their furry friend since we know that cats drink more water if it’s moving. Hydrated cats are happy cats.”
Survey methodology:
This random double-opt-in survey of 2,000 American cat owners was commissioned by PetSafe between Mar. 22 and Mar. 30, 2024. It was conducted by market research company OnePoll, whose team members are members of the Market Research Society and have corporate membership to the American Association for Public Opinion Research (AAPOR) and the European Society for Opinion and Marketing Research (ESOMAR).
54
views
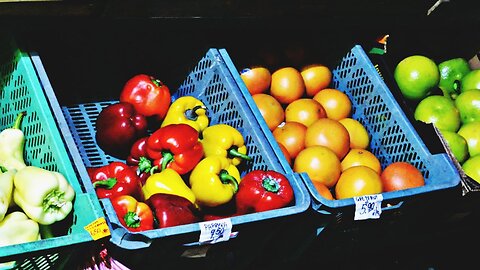
Grocery shopping hungry is costing Americans this much
According to research, grocery shopping on an empty stomach will cost you an extra $26 per trip, on average.
A recent poll of 2,000 general population Americans found that the average person makes two grocery runs per week and budgets $162 for their haul.
The study found that more than three-quarters of respondents (76%) agreed they’re more likely to spend more than they’d like if they grocery shop while hungry and six in ten said they’re also likely to leave their health goals at the door.
A majority (62%) said they’ll typically spend up to 20% more than what they’ve set aside for groceries for the week. Only a fifth (20%) reported that they never overspend what they’ve budgeted for groceries.
Conducted by OnePoll and commissioned by Dole Food Company in honor of National Banana Day on Apr. 17, the study took a comprehensive look at Americans' grocery and produce shopping habits, food needs and priorities when it comes to nourishing themselves.
Respondents reported they need to visit two stores during a typical week to find all the items they need and their standard grocery run takes 39 minutes.
The average person is shopping to feed two while 30% are shopping to feed just themselves.
According to respondents, the best time to shop to avoid rushes and crowds is 8:00 a.m. - 9:59 a.m., the worst time is 4:00 p.m. - 5:59 p.m. and the most popular time is 10:00 a.m - 11:59 a.m.
Over half of Americans (56%) will typically shop with a grocery list and 79% of those who do said they’re less likely to overspend while shopping.
The study also found that three in four (74%) said their grocery hauls are similar to the items their parents would purchase during their childhood.
And 41% have preferred grocery and item brands and said they’re willing to visit an additional store to purchase them if their usual store doesn’t have them in stock.
In fact, according to the research, specific brands can be very important to consumers: 39% of Americans reported that they’re willing to pay more for brands that make their values known when it comes to transparency for sourcing, supply chain and environmental sustainability.
And, on average, respondents would be willing to pay nearly a tenth more (9%), on top of what they’re already spending, if it ensured they could have the highest quality produce and nutrient-dense healthy foods.
The most common “must-haves” for every grocery haul are bread (54%), eggs (52%), meat (51%), milk or milk substitutes (50%), coffee (35%) and bananas (35%).
But despite bananas’ popularity, 60% of respondents were unaware that bananas are the most-purchased grocery item in the U.S.
“A high-quality food shouldn’t break the bank. It should nourish us, be ethically sourced and should be readily available to consumers,” said William Goldfield, director of corporate communications for Dole. “We believe health should be our highest priority and should be reflected in the way people shop. For our 125th anniversary of growing and marketing bananas, we commissioned this study to look at how Americans spend on what’s important to them when it comes to food and their hierarchy of food needs.”
The survey found that Americans rank food variety (35%), quick and convenient foods (34%), protein-rich foods (32%) and inexpensive foods (30%) as their highest food priorities.
The factors that most influence what Americans buy at the supermarket are price (55%), flavor (48%), availability (23%) and nutrients (21%).
And when it comes to produce impulse shopping, respondents are most likely to snag bananas (33%), grapes (30%) and apples (22%) on their way to the checkout line.
The survey also settled the debate about the right stage to eat a banana and found that half (50%) said it’s during the “yellow with no spots” stage although a surprising number (6%) opt to eat their bananas while they’re mostly green.
“Bananas are often accused of being high in sugar content. However, the truth is bananas are a nutrient-dense, inexpensive food full of dietary fiber and vitamins B6 and C that should be part of your diet. Whole foods are intrinsically good for us,” said Goldfield. “We know bananas as a quick snack or addition to a meal, supporting heart health and energy metabolism.”
TOP TEN MUST-HAVE ITEMS FOR EVERY GROCERY TRIP
- Bread - 54%
- Eggs - 52%
- Meat(s) - 51%
- Milk or milk substitutes - 50%
- Coffee - 35%
- Bananas - 35%
- Potatoes - 33%
- Chips - 32%
- Juice - 31%
- Noodles / pasta - 30%
THE RIGHT STAGE TO EAT A BANANA
- Mostly green - 6%
- Green/yellow - 23%
- Yellow with no spots - 50%
- Yellow with brown spots - 13%
- Mostly brown - 1%
Survey methodology:
This random double-opt-in survey of 2,000 general population Americans was commissioned by Dole between Mar. 14 and Mar. 18, 2024. It was conducted by market research company OnePoll, whose team members are members of the Market Research Society and have corporate membership to the American Association for Public Opinion Research (AAPOR) and the European Society for Opinion and Marketing Research (ESOMAR).
70
views

Over 50% of Americans trust Google more than what they learned in school
One-quarter of Americans would rather spend an evening doing homework than their taxes, according to new research.
A survey of 2,000 Americans split evenly by generation (500 Gen Z, 500 millennials, 500 Gen X and 500 baby boomers) revealed that they’d also rather dissect a frog (14%), take the SATs (11%) or take a calculus exam (9%).
The survey also asked respondents how much practical information they learned in school and found that Americans feel like they only use half (52%) of the information they were taught in their adult lives.
This may also be why 55% admit that they rely on Google more than their formal education, with the average American searching five basic questions each day.
Conducted by OnePoll on behalf of the banking app Chime, the survey found that almost one-third (32%) of Americans learned “nothing at all” about personal finances during their formal education.
Results showed that respondents knew more about information that is rarely used in daily life, like the definitions of equilateral (72%), scalene (69%) and isosceles (57%) triangles, than they did about crucial financial information, such as the difference between a W-2 and a W-4 (46%.)
And while more than half (52%) of Gen Zers were able to identify the mitochondria as the powerhouse of the cell, only a quarter (26%) of the same group correctly defined “taxable income” as money, property or services you earn through work, investments and other means.
Results also found that while 63% of all respondents consider themselves smarter than the average middle schooler, 16% of both baby boomers and Gen X don’t feel like they are.
“Everyone has strengths when it comes to money, but it's clear that schools have not taught our country properly on the topic. Results found that 48% of Gen Z and millennial respondents believe that their ‘financial literacy age’ is 20 years old or younger,” said Sara El-Amine, vice president of Community for Chime. “Financial education is a lifelong learning process that takes time and sometimes trial and error. There seems to be a real opportunity in America to build foundational lessons earlier in life and set up everyday people to feel empowered and confident to achieve their financial goals.”
Results also found that there is an eagerness for progress in financial education. Eighty-one percent of respondents would be willing to take an “adulting crash course” or the opportunity to learn relevant skills for being an adult.
The topic that they’d like to learn about most is managing their personal finances (39%), followed by how to do their taxes (33%) and home buying and mortgages (31%).
Others would like to learn how to write a cover letter or resume (23%), how to change the oil in their car (22%) or even how to cook (21%).
Americans also believe that those same topics should be taught in high school, along with workplace etiquette (44%), how to clean (25%) or do laundry (23%) as well as relationship guidance (22%).
When it comes to managing their finances, Americans struggle the most with sticking to a budget (34%), paying off debts (30%) and investing (28%).
Understanding how their finances today impact their future (30%), working with a financial advisor (29%) and taking a class on finances (28%) are the top ways Americans say they would feel more confident in managing their finances.
“Money is a part of our everyday lives — in big ways and small ones — much more so than calculus or geometry. So why isn’t it a standard part of education? The results of the survey really emphasize the importance of building a solid understanding of finance basics in adulthood, and, with Financial Literacy Month in April, there’s no better time to get started,” said El-Amine. “When you feel more confident in understanding your finances, you’ll also feel more confident in taking on the adult world.”
Survey methodology:
This random double-opt-in survey of 2,000 U.S. adults split evenly by generation (500 Gen Z, 500 millennials, 500 Gen X and 500 baby boomers) was commissioned by Chime between Feb. 29 and March 4, 2024. It was conducted by market research company OnePoll, whose team members are members of the Market Research Society and have corporate membership to the American Association for Public Opinion Research (AAPOR) and the European Society for Opinion and Marketing Research (ESOMAR).
37
views

Top 10 most environmentally conscious states
New Mexico, California and Oregon are the self-declared most eco-friendly states, according to new research, commissioned by Avocado Green Mattress and conducted by OnePoll ahead of Earth Day.
The survey of 5,000 Americans, split evenly by state, asked respondents how environmentally conscious they consider themselves on a day-to-day basis, with a scale from 0–10.
New Mexicans came out as the most environmentally conscious, rating themselves as 5.7 out of 10 — with California and Oregon not far behind, with each giving themselves a 5.5.
Following that was a four-way tie, with Delaware, Massachusetts, Vermont and Washington each giving themselves a 5.4 out of 10.
50
views

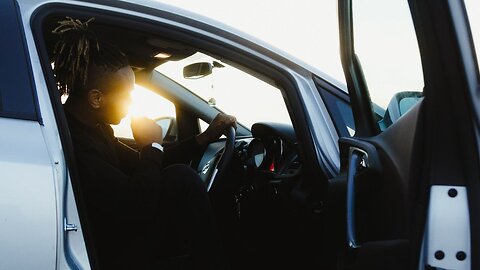
Why 3 in 4 prefer road trips over flying
Nearly three-quarters of Americans prefer driving to their vacation destination over flying, according to new research.
A recent poll of 2,000 American drivers found that the open road is the best way when embarking on an adventure.
So what makes driving the most popular option? Road trip veterans reported the best things about road trips include seeing new landscapes (50%), listening to music (43%), getting a break from their routine (26%) and enjoying the feeling of driving (25%).
In fact, only 22% of respondents will opt to fly rather than drive when going on a trip.
Commissioned by Michelin for Distracted Driving Awareness Month in April, and conducted by OnePoll, the study found that almost half of those who’ve ever gone on a road trip (43%) rank themselves as experienced, and a fifth (21%) go so far as to label themselves as expert-level.
And of those who have ever taken a road trip, the average respondent has racked up the miles, knocking out 16 road trips in their lifetime.
Forty-five percent prefer to assume driving responsibilities for the trip, 22% prefer to have another person drive, and 28% enjoy splitting the driving role with someone else.
The biggest concerns for respondents while on a road trip or long drive include having a safe and reliable car (35%), traffic (32%), staying alert and awake (28%) and being aware of dangerous drivers (27%).
Safety is top of mind for respondents embarking on a long road trip.
The most common hacks respondents use to stay alert and awake on long drives and road trips include listening to music, audiobooks and podcasts (57%), talking to someone else in the car (57%), and drinking coffee or energy drinks (52%).
More than three in five (68%) will also have a check-in schedule while on a long drive or road trip to let friends or family know they’re safe. Twenty-two percent of those will check in halfway through the drive and 20% will send a check-in text or call every two hours.
"Sometimes, a little preparation can go a long way, especially with road trips. The best trips and vacations include a safety plan. As all drivers and road trippers know, you need to account for unexpected bumps in the road,” said Russell Shepherd, technical communications director of Michelin North America. “If you know you have a reliable car and you can safely get to where you’re going, you’ll be better able to enjoy the ride, without worrying about little mishaps.”
For those who have taken a road trip or long drive in the last five years, respondents ranked losing cell service (36%), needing to make frequent bathroom stops (35%) and passengers asking, “Are we there yet?” (27%) as their biggest pet peeves.
But little annoyances aren’t the only things to worry about on the open road: 37% of road trippers have experienced what they’d call a road trip nightmare.
The survey respondents told tales of flat tires, broken down cars, brakes giving out, accidents, blizzards, rock slides, icy roads and troublesome travel companions to name a few. One respondent memorably lost their wallet and pawned a boom box for gas to make it home.
It’s not surprising then that 93% of long-distance drivers agree that they’re able to enjoy themselves to the fullest, make more memories and be fully present on the trip if they know their car is safe and reliable.
Pre-road trip, 79% of road trippers prefer to have their car inspected, either by themselves or by a professional.
Over nine in 10 of those (95%) will check their tires for nails, tread depth and tire pressure, and almost all (94%) say it’s a high priority to have a reliable car when embarking.
“For drivers and road trippers hitting the road this spring and summer, we encourage you to check out your car and make sure it’s in the best shape possible before making the drive,” said Shepherd. “Car trouble is stressful, which isn’t the point of an adventure or vacation.”
THE BEST PARTS OF ROAD TRIPS AND LONG DRIVES
● Seeing new landscapes and scenery — 50%
● Listening to music — 43%
● Getting a break from my routine — 26%
● Enjoying the feeling of driving — 25%
● Trying local food along the way — 24%
● Getting to my destination — 24%
● Talking to the people I’m driving with — 23%
● Getting a chance to clear my head— 19%
● Getting some peace and quiet — 16%
● Listening to podcasts — 8%
● Calling friends or family — 6%
Survey methodology:
This random double-opt-in survey of 2,000 American drivers was commissioned by Michelin between Feb. 9 and Feb. 20, 2024. It was conducted by market research company OnePoll, whose team members are members of the Market Research Society and have corporate membership to the American Association for Public Opinion Research (AAPOR) and the European Society for Opinion and Marketing Research (ESOMAR).
75
views
Why car owners consider their car ‘part of the family’
Half of Americans consider their car to be “part of the family,” according to new research.
The survey of 2,000 American car owners revealed that 51% think of their car as part of the family — and 53% would keep their current car forever if given the option.
For some, this is due to an emotional attachment (22%), while others have fond memories with their current cars (24%).
There are also more practical reasons for why respondents want to keep their current cars: almost six in 10 said it was because of the reliability (58%) their car has given them and 45% said it’s due to the good gas mileage they’re able to get.
From a financial perspective, the majority of drivers surveyed (80%) said they are likely to hold on to their car for as long as possible if they feel it will save them money in the long run.
Others admit that their car needs an upgrade now but they are unable to afford one due to financial constraints (46%).
Conducted by OnePoll on behalf of Meineke, the survey examined respondents’ feelings toward their current cars, as well as their preferences for future car ownership.
Despite their attachment to their current vehicle, only a third (34%) of drivers surveyed said they’d purchase the same make and model for their next car.
On the other hand, 47% said they’d be looking for something different — and for some, this will be an electric vehicle.
Forty-five percent of Americans surveyed believe electric vehicles are the future of car ownership, with younger generations increasingly likely to agree.
Specifically, 69% of Gen Z and 59% of millennials in the survey see electric cars as the future, compared to 41% of Gen X and 32% of baby boomers.
Results revealed that 41% of all respondents are glad that electric vehicles are an option for their future car — with younger generations again more likely to agree (59% of Gen Z and 56% of millennials, compared to 37% of Gen X and 27% of baby boomers surveyed).
"We're witnessing a shift in car ownership trends, propelled by interest in electric vehicles, especially with younger generations who see driving electric as the way of the future," said Christopher Streahle, VP of Marketing Meineke Car Care Centers. "Environmentally friendly transit options are on the rise and drivers are also considering something new, making electric vehicles a compelling option."
The survey asked respondents what would make them consider an electric vehicle as their next car — not having to pay for gas (35%) came out as the No. 1 reason.
Following that, respondents said electric vehicles being better for the environment (33%) and helping to reduce air pollution (29%) were the other top reasons they’d consider owning one.
Rounding out the top five reasons why respondents may look for an electric car in the future were receiving government incentives, such as tax credits (25%) and having a smooth and quick acceleration (17%).
Yet, the research showed Americans still have concerns about electric vehicles: 66% anticipate higher ownership costs, while 41% believe they’ll need to spend more time at a mechanic with an electric car.
Perhaps because of that, 90% of drivers surveyed said it’s important to have a mechanic they trust.
“As the automotive landscape evolves to include more electric vehicles on the road, so do our services," said Mike Baden, owner of Meineke of Indian Land, South Carolina. “Those who opt for electric cars can now take advantage of dependable auto maintenance and drive in confidence knowing their car care needs are met."
WHY WOULD RESPONDENTS HOLD ONTO THEIR CURRENT CAR FOR “AS LONG AS POSSIBLE”?
● Reliability — 58%
● Good gas mileage — 45%
● Inability to upgrade because of financial constraints — 28%
● Fond memories with the car — 24%
● Emotional attachment — 22%
WHY WOULD RESPONDENTS CONSIDER AN ELECTRIC VEHICLE?
● Do not have to pay for gas — 35%
● Better for the environment — 33%
● Reducing air pollution — 29%
● Government incentives, such as tax credits — 25%
● Smooth and quick acceleration — 17%
● Reducing noise pollution — 17%
● Prefer to charge a battery than pump gas — 13%
Survey methodology:
This random double-opt-in survey of 2,000 American drivers was commissioned by Meineke between Feb. 29 and March 4, 2024. It was conducted by market research company OnePoll, whose team members are members of the Market Research Society and have corporate membership to the American Association for Public Opinion Research (AAPOR) and the European Society for Opinion and Marketing Research (ESOMAR).
32
views