Falling Wedge Chart Pattern Analysis | Technical Analysis in Urdu
Falling Wedge Chart Pattern Analysis | Technical Analysis in Urdu(@Algotrick
Falling Wedge Chart Pattern Analysis in Urdu/Hindi. Technical Analysis in Urdu/Hindi
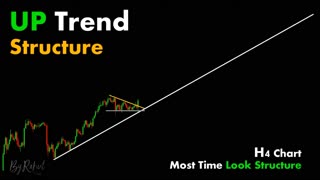
Falling Wedge Price Action is a bullish pattern that begins wide at the top and contracts as prices move lower. This price action forms a cone that slopes down as the reaction highs and reaction lows converge. In contrast to symmetrical triangles, which have no definitive slope and no bias, falling wedges definitely slope down and have a bullish bias. However, this bullish bias cannot be realized until a resistance breakout occurs.
While this article will focus on the falling wedge as a reversal pattern, it can also fit into the continuation category. As a continuation pattern, the falling wedge will still slope down, but the slope will be against the prevailing uptrend. As a reversal pattern, the falling wedge slopes down and with the prevailing trend. Regardless of the type (reversal or continuation), falling wedges are regarded as bullish patterns.
#FallingWedge #PriceAction #ChartPattern Bearish reversal chart pattern Bullish reversal chart pattern
Stop Loss Theory Analaysis in Hindi. Technical Analysis in Urdu
Through this channel you can successfully chart the analysis.
It can also determine when the trend will be established and the trend will be reversal.
Know the breakthrough time of breakout and break down.
And most importantly when do you have to buy and when to sell
You can answer the same with the help of Technical Analysis and Candlestick Charts Patterns.
Also, you can reduce profits in every type of market.
Rising wedge pattern
Rising wedge pattern breakout
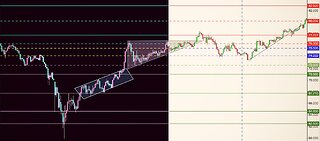
Falling wedge pattern bullish
Falling wedge pattern breakout charti
Falling wedge in downtrend
Falling wedge pattern bullish or bearish
Triangle wedge pattern
Falling wedge pattern target
Horizontal wedge pattern
Falling wedge reversal pattern
Types of wedge pattern
Expanding wedge pattern
Falling wedge pattern meaning
Descending broadening wedge pattern
How do you calculate breakout volume?
How do you find the breakout level of a stock?
How do you measure head and shoulders breakout?
How do you set a breakout target?
What is a falling wedge breakout?
Is a falling wedge pattern bullish?
What happens after a falling wedge breakout?
How do you measure a breakout from a faling wedge?
falling wedge pattern
falling wedge chart pattern
falling wedge
falling wedge pattern tamil
falling wedge pattern breakout
falling wedge and rising wedge
falling wedge pattern scanner
falling wedge breakout
falling wedge reversal pattern
falling wedge indicator
#banknifty
#nifty
#stockmarket
#trading
#artoftrading
#market
#forextrading
#optionstrading
#baapofchart
#boomtrade
-
 7:43
7:43
Ascencore
4 months agoStock Chart Technical Analysis (3 Methods Falling) Candlestick Chart Pattern Analysis
14 -
 2:58
2:58
Ascencore
4 months agoStock Chart Technical Analysis (3 Methods Rising) Candlestick Chart Pattern Analysis
31 -
 7:02
7:02
Ascencore
4 months agoStock Chart Technical Analysis (Doji) Candlestick Chart Pattern Analysis
32 -
 0:12
0:12
DanilMoney
9 months agoTechnical analysis notes _ Chart patterns pdfs _ Josh trade
3 -
 0:21
0:21
philosop
1 year agoCHART PATTERN BREAKOUT (#15)
11 -
 5:42
5:42
ChartAction
3 years agoFalling wedge American Airlines Stock Price Technical Analysis AAL
25 -
 7:22
7:22
Milgard
6 months agoHow To Find Trendlines On Cryptocurrency Charts BTC-USD Case Study
13 -
 7:14
7:14
Ascencore
4 months agoStock Chart Technical Analysis (Hanging Man) Candlestick Chart Pattern Analysis
8 -
 1:30
1:30
Ascencore
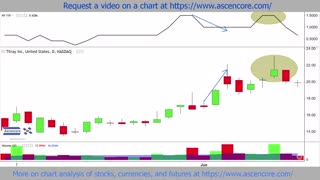
5 months agoTLRY Chart Analysis With The Advance Decline IndicatorAdvance DeclineBreadth indicator
17 -
 1:00
1:00
Cryptostreets
1 year agoBITCOIN AND ETHEREUM CHART ANALYSIS – BEWARE!