Stock Market Valuation Series Part 4: Buffett Indicator Model
My Exclusive Free Workshop The Four P's of Building a Successful Investing Program → https://spxinvesting.mailchimpsites.com
Blog: https://spxinvestingblog.com
https://www.facebook.com/groups/433843641082343
https://www.multpl.com/sitemap
https://www.currentmarketvaluation.com/
Videos Referenced:
Valuation Video Part 1 Miltpl.com: https://youtu.be/y0BxSkpJotA
Valuation Video Part 2 The Shiller PE Ratio: https://youtu.be/3VNCA89kWDo
Market Valuation Series Part 4: Buffett Indicator Model: https://youtu.be/5Vo9OfMuAss
Is the Stock Market Getting Ready to Crash? https://youtu.be/F4VUuOBy4mc
S&P 500 P/E Ratio Valuation Update August 1, 2021: https://youtu.be/9f3JSj0EpUY
Stock Market Valuation
Part 4
The Buffett Indicator
Tools can be used to determine if the stock market is:
Overvalued: Expensive
Undervalued: Cheap
Fairly Valued: Just about right
The Buffett Indicator
Named after Warren Buffett.
Compares the value of the US stock market to GDP.
Valuation Level
Is 238% high, low, or just right?
The historical average has been about 120%
238% is 1.98 times higher.
Warren Buffett Statement
Warren Buffett is said to have called the ratio "the best single measure of where valuations stand at any given moment".
Buffett has since walked back those comments, hesitating to endorse any single measure as either comprehensive or consistent over time.
Calculation
The Buffett Indicator is calculated by using two points of data:
1. Total Market Value
2. GDP
Gross Domestic Product (GDP)
GDP is the largest measurement of the total production of the US economy.
Released quarterly
Historical measurement
CMV updates GDP with forecasts
Current forecast is $23.0T
Shortcomings
The Buffett Indicator is not perfect.
It is not a “one-size-fits-all” indicator.
Other markets such as bonds (Interest rates) are not considered in context of the Buffett Indicator to the stock market.
Today, investors are buying stocks to get good returns since interest rates are so low. During other times, investors bought stocks for returns and not as an alternative to low interest rates.
Fear and greed dictate action
Before: Greed over necessity
Now: Necessity over greed
Conclusion
The Buffett Indicator posted by the Current Market Valuation website is Strongly Overvalued.
Other Stock Market Valuation measurements show that the S&P 500 is OVERVALUED.
No immediate action is necessarily warranted.
However, it is necessary to have a plan developed and in place in case the market environment changes.
If other measurement tools suggest a major change in trend (up to down) implementing a plan will be in order for:
Those who have only long positions (defensive).
Those who participate in short positions (offensive).
-
 21:37
21:37
The SPX Investing Program
2 years ago $0.09 earnedMarket Valuation Series Part 1: Multpl.com
194 -
 2:35
2:35
Ascencore
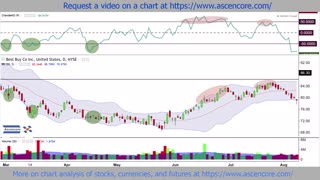
5 months agoStock Chart Analysis With The Bollinger Bands %B Indicator
7 -
 18:27
18:27
The SPX Investing Program
2 years ago $0.20 earnedMarket Valuation Series Part 2: Shiller PE Ratio
247 -
 8:42
8:42
EasyMoney
1 year agoWarren Buffett:The Stock Market is Changing
3 -
 59:46
59:46
The Phil's Gang Radio Show Channel
6 months agoStock Market Analysis 11/17/2023
240 -
 6:06
6:06
Brian Shannon
2 years agoStock Market Analysis 1/13/22
60 -
 2:20
2:20
Ascencore
4 months ago(BBY) Best Buy Stock Chart Analysis With The Chande Momentum Oscillator & Bollinger Bands
19 -
 2:58
2:58
Ascencore
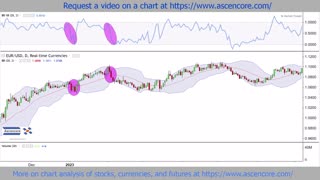
5 months agoForex Chart Analysis With The Bollinger Bands %B Indicator
16 -
 4:19
4:19
Fanatical Finance
2 years agoUnderstanding the Stock Market Part 2! | What is the Stock Market?
645 -
 5:42
5:42
StonkMarket
8 months agoWhy Did Buffett Sell $13 Billion of stocks?
1