Market Valuation Series Part 2: Shiller PE Ratio
My Exclusive Free Workshop The Four P's of Building a Successful Investing Program → https://spxinvesting.mailchimpsites.com
Blog: https://spxinvestingblog.com
https://www.facebook.com/groups/43384...
https://www.multpl.com/sitemap
Videos Referenced:
Valuation Video Part 1: https://youtu.be/y0BxSkpJotA
Is the Stock Market Getting Ready to Crash? https://youtu.be/F4VUuOBy4mc
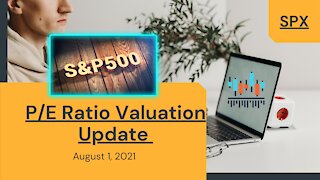
S&P 500 P/E Ratio Valuation Update August 1, 2021: https://youtu.be/9f3JSj0EpUY
Books Referenced:
Irrational Exuberance: https://amz.run/4okY
Security Analysis: https://amz.run/4oki
Intelligent Investor: https://amz.run/4okk
Market Valuation
This is part 2 of a series.
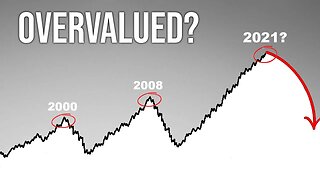
Tools can be used to determine if the stock market is:
Overvalued: Expensive
Undervalued: Cheap
Fairly Valued: Just about right
The P/E 10 Ratio:
A measurement tool for stock valuation.
Developed by Robert Shiller and discussed in his book "Irrational Exuberance.“
Usually applied to broad indexes such as the Dow, S&P 500, NASDAQ 100, etc.
Uses real earnings with profits that are CPI adjusted for inflation as opposed to the Trailing Twelve Months (TTM), which can fluctuate.
The real earnings are smoothed, or averaged, over 10 years for greater consistency.
The P/E 10 Ratio is also known as:
CAPE: Cyclically Adjusted Price-to-Earnings
Shiller PE Ratio
Logic of the P/E 10
Robert Shiller sought to improve upon the extraordinary and legendary work of Benjamin Graham and David Dodd. "Security Analysis" was released in 1934. Although dry, it should be in all investors’ libraries.
Graham and Dodd stated that P/E ratios can often be temporarily illogical and produce extreme readings. In order to smooth earnings, Graham and Dodd suggested using an average of earnings per share (EPS).
The Shiller P/E Ratio uses a 10-year average.
Calculation
The annual EPS of all stocks that comprise the S&P 500 are adjusted for inflation using the Consumer Price Index (CPI).
A 10-year average is calculated.
The current value of the S&P 500 is divided by the 10-year average EPS number.
The result is the P/E 10 ratio, CAPE ratio or Shiller P/E Ratio.
P/E 10 Ratio vs. P/E Ratio (Standard)
Real Earnings VS Trailing Twelve Months (TTM)
Real Earnings
Annual
Real profitability
Accounts for inflation
Trailing Twelve Months (TTM)
Previous 12 months
Monthly or quarterly
Not the fiscal year-end
P/E Ratio
Uses TTM
Recent quarters
Not averaged
Not cyclically adjusted
Analysis: static numbers
P/E 10 Ratio
Uses Real Earnings
Annual
Averaged (10 years)
Inflation adjusted
Analysis: Based on mean
Drawbacks
Both the P/E Ratio (Standard) and P/E 10 can be useful tools but should not be used in isolation.
The desire to determine tops and bottoms is not assured.
Manipulation and accounting “tricks” can provide a distorted view of earnings.
Conclusion
Use both
Decisions should not be based on only these measurements
Take notice when readings are extreme
Develop a plan to implement if things turn based on other analysis tools.
-
 21:37
21:37
The SPX Investing Program
2 years ago $0.09 earnedMarket Valuation Series Part 1: Multpl.com
194 -
 35:07
35:07
The SPX Investing Program
2 years agoS&P 500 P/E Ratio Valuation Update August 1, 2021
230 -
 13:20
13:20
FASTGraphs
3 years ago5 - The P/E Ratio Demystified
27 -
 12:46
12:46
FineTimer
1 year agoFundamental Analysis: The Key to Finding Undervalued Stocks
17 -
 6:28
6:28
SniperTrader
1 month agoMarket Awaits CPI Inflation Data
24 -
 4:40
4:40
LumleyTrading
1 year ago$PLTR Stock Analysis - Palantir Price Targets & Technical Analysis
35 -
 11:54
11:54
Cooper Academy
3 years agoHow To Tell When The Stock Market Is Overvalued
35 -
 8:18
8:18
LumleyTrading
1 year ago$PLTR Stock Analysis - Palantir WILL FALL FROM HERE
18 -
 11:24
11:24
AV
8 months ago#192 Price-Earnings Ratio
25 -
 14:23
14:23
We Profit with Stock Curry
1 year agoPPI Report Today - PPI Data Could Tank the Stock Market
619