Excel 2016 Waterfall Chart - Advantages and Limitations - Ultimate guide to Excel's Bridge Graph
Sep 27, 2016
For the complete course click here: https://courses.xelplus.com/p/excel-waterfall-chart-course
For the full blog post refer to this link: http://www.xelplus.com/waterfall-chart-in-excel-2016-advantages-limitations/
Excel 2016 Waterfall Chart - Advantages and Limitations (Disadvantages) - All you need to know about Excel 2016 Waterfall Graph and how to create the waterfall chart from scratch.
Details:
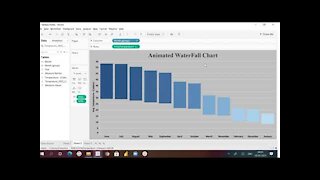
A waterfall chart or a bridge chart is a way of visualizing your data that helps you understand how you got from one balance to another balance. They are common for financial figures – they allow you to see the profit development – how to you get from gross sales to net income or how your EBIT or earnings developed from last year to this year. But they are also a good story teller for non-financial data.
The waterfall chart is also a very liked chart by management. For good reason too. It’s a neat way of presenting your data and explaining the story. But it’s a very difficult chart for people create and maintain. It’s one of the most common charts for which people use additional third-party add-ins for. That was the reason Excel 2016 introduced a built-in waterfall. Extremely user-friendly but not flexible. Same problem you have with many add-ins. Hence the reason for this course.
Microsoft Excel 2016 came with a built-in waterfall chart. It made a lot of people happy because it made their life simpler. I was super excited when I heard about it and really impressed how simple it is to create a chart. But then when I started to make adjustments to the chart I realized it’s not that flexible. Basically ease of use came at the cost of flexibility.
In this lecture I’m going to show you how to use the Excel 2016 standard waterfall chart. How simple and great it is. I am also gonna go through it’s restrictions and why I still prefer to create the waterfall chart from scratch. Even in Excel 2016. It obviously involves more steps but it comes with great flexibility.
The advantages of the Excel 2016 waterfall chart are:
Very Easy to Create the new Excel 2016 Waterfall
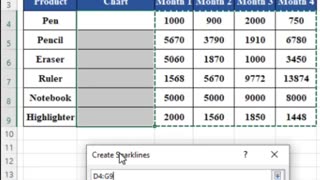
Does not require any special data preparation
The disadvantages of Excel 2016 Waterfall Graph are:
Chart title cannot reference cells - formula can't be used here
Colors can only be controlled via global color scheme
Waterfall Connector color cannot be adjusted
Data Label position is restricted (not possible to have negative data labels to show above)
No other series can be added to the chart - not visible
Incorrect display of values in Waterfall when in the negative vertical axis (below horizontal axis)
Not all chart functionalities are available
Only compatible for anyone using Excel 2016
★ My Online Excel Courses ► https://courses.xelplus.com/
✉ Subscribe & get my TOP 10 Excel formulas e-book for free
https://www.xelplus.com/free-ebook/
EXCEL RESOURCES I Recommend: https://www.xelplus.com/resources/
Get Office 365: https://microsoft.msafflnk.net/15OEg
Microsoft Surface: https://microsoft.msafflnk.net/c/1327040/451518/7593
GEAR
Camera: https://amzn.to/2FLiFho
Screen recorder: http://techsmith.pxf.io/c/1252781/347799/5161
Microphone: https://amzn.to/2DVKstA
Lights: http://amzn.to/2eJKg1U
Note: This description contains affiliate links, which means at no additional cost to you, we will receive a small commission if you make a purchase using the links. This helps support the channel and allows us to continue to make videos like this. Thank you for your support!
-
 0:11
0:11
SKILL-LAND
9 months agoSales trend chart in Excel ✓ Draw Excel chart ✓ Excel tricks ✓ Excel tips #excelchart #excelshorts
7 -
 8:48
8:48
Learning Together
3 years agoAnimated Waterfall Chart in Tableau
24 -
 5:13
5:13
Tuts4dummies
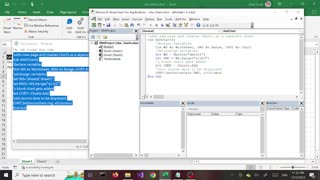
10 months agoExcel | VBA | How to Add Chart
272 -
 45:50
45:50
Hiddenfeelin
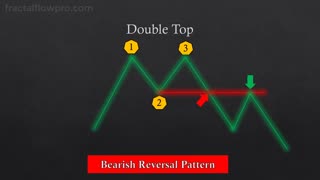
6 months agoThe ULTIMATE Beginner's Guide to CHART PATTERNS
2 -
 1:41
1:41
PorcunaByte
1 year agoMicrosoft Excel - Charts
1 -
 44:43
44:43
Microsoft Excel Full Course
3 years agoExcel 365 Part 14 – Chart
92 -
 5:49
5:49
The Excel Zone
1 year ago8 AMAZING BENEFITS OF USING EXCEL TABLE
150 -
 1:59
1:59
Business Pearl
1 year ago5 Free charting software's and websites for technical analysis
1 -
 4:54
4:54
Tuts4dummies
10 months agoExcel | VBA | How to add chart | part 2
10 -
![How To Create a 1 Click Organizational Chart In Excel [Masterclass + Free Download]](https://hugh.cdn.rumble.cloud/s/s8/1/6/V/F/k/6VFkc.0kob-small-How-To-Create-a-1-Click-Org.jpg) 1:16:40
1:16:40
Excel For Freelancers
2 years agoHow To Create a 1 Click Organizational Chart In Excel [Masterclass + Free Download]
64