

German DAX update Mar 01 2024
German DAX update Mar 01, 2024
Welcome to Pete’s investing updates
in this strategy edition we will be talking about trading using the Commodity Channel Index Indicator with a weighted moving average, and applying a % Gain and Average Down approach.
#GermanDAX #sharetrading #averagedown #MovingAverage #CCI #CommodityChannelIndex #HeikenAshi
Become a PetesInvesting Patreon member with same day updates on
https://www.patreon.com/petesinvesting
Become a PetesInvesting Patreon member with weekly scans on
https://www.patreon.com/petesinvesting
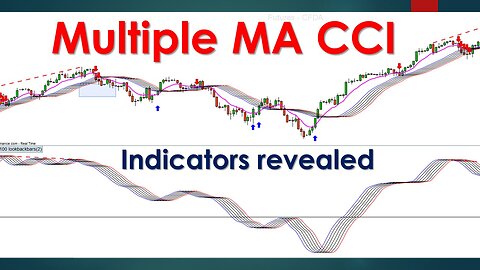
Pete's Multiple Indicator Indicator
https://youtu.be/2uGsgJ54DNw?si=qk7Ylq8R7Lw2LNNS
Multiple Moving Average on Price and CCI150
https://youtu.be/CFvryakYpZo?si=O8kxDoEA0OAl5IRt
Mult MA Oscillator strategy
https://youtu.be/u7gC6uFLskM
PART 2 CCI1500 and MA400 with Moving Average Difference
https://youtu.be/qdxp-QlWl1g
CCI350 Commodity Channel Index strategy
https://youtu.be/xEqQkeI4aUE
A Very Simple Moving Average (EMA9 MA20)
https://youtu.be/k9FStX2ke9g
Stochastic trading strategy quickie
https://youtu.be/RgFcN0zewjY
Don't forget...
First always remember to review petesinvesting channel playlists
Updated every weekend I look at the charts of some select blue chip shares as well as some key world sharemarket indices.
As always click on the SUBSCRIBE button as well as the NOTIFICATION bell and LIKE this video to support this channel.
If you want me to review an Index a share, a commodity or a FOREX pair, put it in the comments and I'll cover it in a future video
Things
to consider:
•We track and trade on a Daily chart since we want to back test and see results of trades back during the GFC as well as Covid effects.
•We track and back test Revenue over Drawdown requirements
(as a %) to optimize our returns with less exposure.
•Brokerage is included in our back testing. I use $8 per transaction each time we buy or sell. Revenue shown may change slightly depending on your brokerage costs.
•Our Back testing transacts with $2,000 per trade. ie everytime you purchase $2k worth of shares in the instrument you want to invest.
To increase Revenue (ie returns) simply increase this. But beware this will also increase your Drawdown, so ensure you factor in this with your money management strategy.
Lets get started
Remember...
Don't forget to subscribe / LIKE and hit the notification bell and review the PETESINVESTING channel playlists for further reference.
Using a Daily price chart, we review the weekly progress of a sample of Bluechip stocks from Australia, the US and Europe - Telefonica (TEF.BME), Commonwealth Bank Of Australia (CBA.AX), BHP Group Ltd Australia (BHP.AX), JPMorgan and Chase (JPM.NYSE), Volkswagen AG (VOW.XETRA), Johnson & Johnson (JNJ.NYSE), Caterpillar Inc (CAT.NYSE).
Showing any new open and closed positions, profitability and draw down requirements dependent on the trend of the respective price charts.
Supporting videos:
Become a PetesInvesting Patreon member with same day updates on
https://www.patreon.com/petesinvesting
Alligator strategy explained:
https://youtu.be/1SMSRQV7GZE
Rumble updates
https://rumble.com/register/peteeight/
Bitchute updates:
https://www.bitchute.com/channel/pTjWs2A7K9Br/
Money Management:
https://youtu.be/nvvcldeeZS4
Average Down Do's and Don'ts
https://youtu.be/SZbh2Me4kq0
Simple Trading Strategy with CCI and Avg Down technique
https://youtu.be/w35_YtV4YQU
Simple trading strategy https://youtu.be/ibVzRwCX-3Q
Average Down Strategy https://youtu.be/RFCb5S78D8o
17
views
Natural Gas BOIL UNG KOLD Technical Analysis Mar 01 2024
Natural Gas Technical Analysis (BOIL, UNG, KOLD) Mar 01, 2024
Welcome to Pete’s investing updates
in this strategy edition we will be talking about trading using the Commodity Channel Index Indicator with a weighted moving average, and applying a % Gain and Average Down approach.
#NaturalGas #sharetrading #averagedown #MovingAverage #CCI #CommodityChannelIndex #divergence #TradingIdea #HeikenAshi
Become a PetesInvesting Patreon member with weekly scans on
https://www.patreon.com/petesinvesting
Pete's Multiple Indicator Indicator
https://youtu.be/2uGsgJ54DNw?si=qk7Ylq8R7Lw2LNNS
Multiple Moving Average on Price and CCI150
https://youtu.be/CFvryakYpZo?si=O8kxDoEA0OAl5IRt
Mult MA Oscillator strategy
https://youtu.be/u7gC6uFLskM
Don't forget...
First always remember to review petesinvesting channel playlists
Updated every weekend I look at the charts of some select blue chip shares as well as some key world sharemarket indices.
As always click on the SUBSCRIBE button as well as the NOTIFICATION bell and LIKE this video to support this channel.
If you want me to review an Index a share, a commodity or a FOREX pair, put it in the comments and I'll cover it in a future video
Things
to consider:
•We track and trade on a Daily chart since we want to back test and see results of trades back during the GFC as well as Covid effects.
•We track and back test Revenue over Drawdown requirements
(as a %) to optimize our returns with less exposure.
•Brokerage is included in our back testing. I use $8 per transaction each time we buy or sell. Revenue shown may change slightly depending on your brokerage costs.
•Our Back testing transacts with $2,000 per trade. ie everytime you purchase $2k worth of shares in the instrument you want to invest.
To increase Revenue (ie returns) simply increase this. But beware this will also increase your Drawdown, so ensure you factor in this with your money management strategy.
Lets get started
Remember...
Don't forget to subscribe / LIKE and hit the notification bell and review the PETESINVESTING channel playlists for further reference.
Supporting videos:
Become a PetesInvesting Patreon member with same day updates on
https://www.patreon.com/petesinvesting
36
views

NIKKEI update Feb 29 2024
NIKKEI update Feb 29, 2024.
Welcome to Pete’s investing updates
in this strategy edition we will be talking about trading using the Commodity Channel Index Indicator with a weighted moving average, and applying a % Gain and Average Down approach.
#NIKKEI #sharetrading #averagedown #MovingAverage #CCI #CommodityChannelIndex #divergence #HeikenAshi
Become a PetesInvesting Patreon member with weekly scans on
https://www.patreon.com/petesinvesting
Pete's Multiple Indicator Indicator
https://youtu.be/2uGsgJ54DNw?si=qk7Ylq8R7Lw2LNNS
Multiple Moving Average on Price and CCI150
https://youtu.be/CFvryakYpZo?si=O8kxDoEA0OAl5IRt
Mult MA Oscillator strategy
https://youtu.be/u7gC6uFLskM
Don't forget...
First always remember to review petesinvesting channel playlists
Updated every weekend I look at the charts of some select blue chip shares as well as some key world sharemarket indices.
As always click on the SUBSCRIBE button as well as the NOTIFICATION bell and LIKE this video to support this channel.
If you want me to review an Index a share, a commodity or a FOREX pair, put it in the comments and I'll cover it in a future video
Things
to consider:
•We track and trade on a Daily chart since we want to back test and see results of trades back during the GFC as well as Covid effects.
•We track and back test Revenue over Drawdown requirements
(as a %) to optimize our returns with less exposure.
•Brokerage is included in our back testing. I use $8 per transaction each time we buy or sell. Revenue shown may change slightly depending on your brokerage costs.
•Our Back testing transacts with $2,000 per trade. ie everytime you purchase $2k worth of shares in the instrument you want to invest.
To increase Revenue (ie returns) simply increase this. But beware this will also increase your Drawdown, so ensure you factor in this with your money management strategy.
Lets get started
Remember...
Don't forget to subscribe / LIKE and hit the notification bell and review the PETESINVESTING channel playlists for further reference.
Using a Daily price chart, we review the weekly progress of a sample of Bluechip stocks from Australia, the US and Europe - Telefonica (TEF.BME), Commonwealth Bank Of Australia (CBA.AX), BHP Group Ltd Australia (BHP.AX), JPMorgan and Chase (JPM.NYSE), Volkswagen AG (VOW.XETRA), Johnson & Johnson (JNJ.NYSE), Caterpillar Inc (CAT.NYSE).
Showing any new open and closed positions, profitability and draw down requirements dependent on the trend of the respective price charts.
38
views
2
comments
BITCOIN Technical Analysis Feb 29 2024
BITCOIN Technical Analysis Feb 29, 2024 using Heiken Ashi and Commodity Channel Index.
Welcome to Pete’s investing updates
in this strategy edition we will be talking about trading using the Commodity Channel Index Indicator with a weighted moving average, and applying a % Gain and Average Down approach.
#BTC #BITI #MARA #RIOT #BITCOIN #ASX200 #sharetrading #averagedown #MovingAverage #CCI #CommodityChannelIndex #divergence #HeikenAshi
Become a PetesInvesting Patreon member with weekly scans on
https://www.patreon.com/petesinvesting
Pete's Multiple Indicator Indicator
https://youtu.be/2uGsgJ54DNw?si=qk7Ylq8R7Lw2LNNS
Multiple Moving Average on Price and CCI150
https://youtu.be/CFvryakYpZo?si=O8kxDoEA0OAl5IRt
Mult MA Oscillator strategy
https://youtu.be/u7gC6uFLskM
Don't forget...
First always remember to review petesinvesting channel playlists
Updated every weekend I look at the charts of some select blue chip shares as well as some key world sharemarket indices.
As always click on the SUBSCRIBE button as well as the NOTIFICATION bell and LIKE this video to support this channel.
If you want me to review an Index a share, a commodity or a FOREX pair, put it in the comments and I'll cover it in a future video
Things
to consider:
•We track and trade on a Daily chart since we want to back test and see results of trades back during the GFC as well as Covid effects.
•We track and back test Revenue over Drawdown requirements
(as a %) to optimize our returns with less exposure.
•Brokerage is included in our back testing. I use $8 per transaction each time we buy or sell. Revenue shown may change slightly depending on your brokerage costs.
•Our Back testing transacts with $2,000 per trade. ie everytime you purchase $2k worth of shares in the instrument you want to invest.
To increase Revenue (ie returns) simply increase this. But beware this will also increase your Drawdown, so ensure you factor in this with your money management strategy.
Lets get started
Remember...
Don't forget to subscribe / LIKE and hit the notification bell and review the PETESINVESTING channel playlists for further reference.
22
views
Natural Gas BOIL UNG KOLD Technical Analysis Feb 29 2024
Natural Gas Technical Analysis (BOIL, UNG, KOLD) Feb 29, 2024
Welcome to Pete’s investing updates
in this strategy edition we will be talking about trading using the Commodity Channel Index Indicator with a weighted moving average, and applying a % Gain and Average Down approach.
#NaturalGas #sharetrading #averagedown #MovingAverage #CCI #CommodityChannelIndex #divergence #TradingIdea #HeikenAshi
Become a PetesInvesting Patreon member with weekly scans on
https://www.patreon.com/petesinvesting
Pete's Multiple Indicator Indicator
https://youtu.be/2uGsgJ54DNw?si=qk7Ylq8R7Lw2LNNS
Multiple Moving Average on Price and CCI150
https://youtu.be/CFvryakYpZo?si=O8kxDoEA0OAl5IRt
Mult MA Oscillator strategy
https://youtu.be/u7gC6uFLskM
Don't forget...
First always remember to review petesinvesting channel playlists
Updated every weekend I look at the charts of some select blue chip shares as well as some key world sharemarket indices.
As always click on the SUBSCRIBE button as well as the NOTIFICATION bell and LIKE this video to support this channel.
If you want me to review an Index a share, a commodity or a FOREX pair, put it in the comments and I'll cover it in a future video
Things
to consider:
•We track and trade on a Daily chart since we want to back test and see results of trades back during the GFC as well as Covid effects.
•We track and back test Revenue over Drawdown requirements
(as a %) to optimize our returns with less exposure.
•Brokerage is included in our back testing. I use $8 per transaction each time we buy or sell. Revenue shown may change slightly depending on your brokerage costs.
•Our Back testing transacts with $2,000 per trade. ie everytime you purchase $2k worth of shares in the instrument you want to invest.
To increase Revenue (ie returns) simply increase this. But beware this will also increase your Drawdown, so ensure you factor in this with your money management strategy.
Lets get started
Remember...
Don't forget to subscribe / LIKE and hit the notification bell and review the PETESINVESTING channel playlists for further reference.
Supporting videos:
Become a PetesInvesting Patreon member with same day updates on
https://www.patreon.com/petesinvesting
12
views
High Grade Copper Technical Analysis Feb 28 2024
High Grade Copper Technical Analysis Feb 28, 2024.
Welcome to Pete’s investing updates
in this strategy edition we will be talking about trading using the Commodity Channel Index Indicator with a weighted moving average, and applying a % Gain and Average Down approach.
#HG #HighGradeCopper #sharetrading #averagedown #MovingAverage #CCI #CommodityChannelIndex #divergence #HeikenAshi
Become a PetesInvesting Patreon member with same day updates on
https://www.patreon.com/petesinvesting
Pete's Multiple Indicator Indicator
https://youtu.be/2uGsgJ54DNw?si=qk7Ylq8R7Lw2LNNS
Multiple Moving Average on Price and CCI150
https://youtu.be/CFvryakYpZo?si=O8kxDoEA0OAl5IRt
Mult MA Oscillator strategy
https://youtu.be/u7gC6uFLskM
Don't forget...
First always remember to review petesinvesting channel playlists
Updated every weekend I look at the charts of some select blue chip shares as well as some key world sharemarket indices.
As always click on the SUBSCRIBE button as well as the NOTIFICATION bell and LIKE this video to support this channel.
If you want me to review an Index a share, a commodity or a FOREX pair, put it in the comments and I'll cover it in a future video
Things
to consider:
•We track and trade on a Daily chart since we want to back test and see results of trades back during the GFC as well as Covid effects.
•We track and back test Revenue over Drawdown requirements
(as a %) to optimize our returns with less exposure.
•Brokerage is included in our back testing. I use $8 per transaction each time we buy or sell. Revenue shown may change slightly depending on your brokerage costs.
•Our Back testing transacts with $2,000 per trade. ie everytime you purchase $2k worth of shares in the instrument you want to invest.
To increase Revenue (ie returns) simply increase this. But beware this will also increase your Drawdown, so ensure you factor in this with your money management strategy.
Lets get started
Remember...
Don't forget to subscribe / LIKE and hit the notification bell and review the PETESINVESTING channel playlists for further reference.
26
views

German DAX update Feb 28 2024
German DAX update Feb 28, 2024
Welcome to Pete’s investing updates
in this strategy edition we will be talking about trading using the Commodity Channel Index Indicator with a weighted moving average, and applying a % Gain and Average Down approach.
#GermanDAX #sharetrading #averagedown #MovingAverage #CCI #CommodityChannelIndex #HeikenAshi
Become a PetesInvesting Patreon member with same day updates on
https://www.patreon.com/petesinvesting
Become a PetesInvesting Patreon member with weekly scans on
https://www.patreon.com/petesinvesting
Pete's Multiple Indicator Indicator
https://youtu.be/2uGsgJ54DNw?si=qk7Ylq8R7Lw2LNNS
Multiple Moving Average on Price and CCI150
https://youtu.be/CFvryakYpZo?si=O8kxDoEA0OAl5IRt
Mult MA Oscillator strategy
https://youtu.be/u7gC6uFLskM
PART 2 CCI1500 and MA400 with Moving Average Difference
https://youtu.be/qdxp-QlWl1g
CCI350 Commodity Channel Index strategy
https://youtu.be/xEqQkeI4aUE
A Very Simple Moving Average (EMA9 MA20)
https://youtu.be/k9FStX2ke9g
Stochastic trading strategy quickie
https://youtu.be/RgFcN0zewjY
Don't forget...
First always remember to review petesinvesting channel playlists
Updated every weekend I look at the charts of some select blue chip shares as well as some key world sharemarket indices.
As always click on the SUBSCRIBE button as well as the NOTIFICATION bell and LIKE this video to support this channel.
If you want me to review an Index a share, a commodity or a FOREX pair, put it in the comments and I'll cover it in a future video
Things
to consider:
•We track and trade on a Daily chart since we want to back test and see results of trades back during the GFC as well as Covid effects.
•We track and back test Revenue over Drawdown requirements
(as a %) to optimize our returns with less exposure.
•Brokerage is included in our back testing. I use $8 per transaction each time we buy or sell. Revenue shown may change slightly depending on your brokerage costs.
•Our Back testing transacts with $2,000 per trade. ie everytime you purchase $2k worth of shares in the instrument you want to invest.
To increase Revenue (ie returns) simply increase this. But beware this will also increase your Drawdown, so ensure you factor in this with your money management strategy.
Lets get started
Remember...
Don't forget to subscribe / LIKE and hit the notification bell and review the PETESINVESTING channel playlists for further reference.
Using a Daily price chart, we review the weekly progress of a sample of Bluechip stocks from Australia, the US and Europe - Telefonica (TEF.BME), Commonwealth Bank Of Australia (CBA.AX), BHP Group Ltd Australia (BHP.AX), JPMorgan and Chase (JPM.NYSE), Volkswagen AG (VOW.XETRA), Johnson & Johnson (JNJ.NYSE), Caterpillar Inc (CAT.NYSE).
Showing any new open and closed positions, profitability and draw down requirements dependent on the trend of the respective price charts.
Supporting videos:
Become a PetesInvesting Patreon member with same day updates on
https://www.patreon.com/petesinvesting
Alligator strategy explained:
https://youtu.be/1SMSRQV7GZE
Rumble updates
https://rumble.com/register/peteeight/
Bitchute updates:
https://www.bitchute.com/channel/pTjWs2A7K9Br/
Money Management:
https://youtu.be/nvvcldeeZS4
Average Down Do's and Don'ts
https://youtu.be/SZbh2Me4kq0
Simple Trading Strategy with CCI and Avg Down technique
https://youtu.be/w35_YtV4YQU
Simple trading strategy https://youtu.be/ibVzRwCX-3Q
Average Down Strategy https://youtu.be/RFCb5S78D8o
36
views
Natural Gas BOIL UNG KOLD Technical Analysis Feb 28 2024
Natural Gas Technical Analysis (BOIL, UNG, KOLD) Feb 28, 2024
Welcome to Pete’s investing updates
in this strategy edition we will be talking about trading using the Commodity Channel Index Indicator with a weighted moving average, and applying a % Gain and Average Down approach.
#NaturalGas #sharetrading #averagedown #MovingAverage #CCI #CommodityChannelIndex #divergence #TradingIdea #HeikenAshi
Become a PetesInvesting Patreon member with weekly scans on
https://www.patreon.com/petesinvesting
Pete's Multiple Indicator Indicator
https://youtu.be/2uGsgJ54DNw?si=qk7Ylq8R7Lw2LNNS
Multiple Moving Average on Price and CCI150
https://youtu.be/CFvryakYpZo?si=O8kxDoEA0OAl5IRt
Mult MA Oscillator strategy
https://youtu.be/u7gC6uFLskM
Don't forget...
First always remember to review petesinvesting channel playlists
Updated every weekend I look at the charts of some select blue chip shares as well as some key world sharemarket indices.
As always click on the SUBSCRIBE button as well as the NOTIFICATION bell and LIKE this video to support this channel.
If you want me to review an Index a share, a commodity or a FOREX pair, put it in the comments and I'll cover it in a future video
Things
to consider:
•We track and trade on a Daily chart since we want to back test and see results of trades back during the GFC as well as Covid effects.
•We track and back test Revenue over Drawdown requirements
(as a %) to optimize our returns with less exposure.
•Brokerage is included in our back testing. I use $8 per transaction each time we buy or sell. Revenue shown may change slightly depending on your brokerage costs.
•Our Back testing transacts with $2,000 per trade. ie everytime you purchase $2k worth of shares in the instrument you want to invest.
To increase Revenue (ie returns) simply increase this. But beware this will also increase your Drawdown, so ensure you factor in this with your money management strategy.
Lets get started
Remember...
Don't forget to subscribe / LIKE and hit the notification bell and review the PETESINVESTING channel playlists for further reference.
Supporting videos:
Become a PetesInvesting Patreon member with same day updates on
https://www.patreon.com/petesinvesting
11
views
Silver XAGUSD SLV AG Technical Analysis Feb 27 2024
Silver XAGUSD SLV AG Technical Analysis Feb 27, 2024
Welcome to Pete’s investing updates
in this strategy edition we will be talking about trading using the Commodity Channel Index Indicator with a weighted moving average, and applying a % Gain and Average Down approach.
#Silver #XAGUSD #SLV #AG #SpotSilver #iSharesSilverTrust #FirstMajesticSilverCorp #sharetrading #averagedown #MovingAverage #CCI #CommodityChannelIndex #divergence #HeikenAshi
Become a PetesInvesting Patreon member with weekly scans on
https://www.patreon.com/petesinvesting
Pete's Multiple Indicator Indicator
https://youtu.be/2uGsgJ54DNw?si=qk7Ylq8R7Lw2LNNS
Multiple Moving Average on Price and CCI150
https://youtu.be/CFvryakYpZo?si=O8kxDoEA0OAl5IRt
Mult MA Oscillator strategy
https://youtu.be/u7gC6uFLskM
Don't forget...
First always remember to review petesinvesting channel playlists
Updated every weekend I look at the charts of some select blue chip shares as well as some key world sharemarket indices.
As always click on the SUBSCRIBE button as well as the NOTIFICATION bell and LIKE this video to support this channel.
If you want me to review an Index a share, a commodity or a FOREX pair, put it in the comments and I'll cover it in a future video
Things
to consider:
•We track and trade on a Daily chart since we want to back test and see results of trades back during the GFC as well as Covid effects.
•We track and back test Revenue over Drawdown requirements
(as a %) to optimize our returns with less exposure.
•Brokerage is included in our back testing. I use $8 per transaction each time we buy or sell. Revenue shown may change slightly depending on your brokerage costs.
•Our Back testing transacts with $2,000 per trade. ie everytime you purchase $2k worth of shares in the instrument you want to invest.
To increase Revenue (ie returns) simply increase this. But beware this will also increase your Drawdown, so ensure you factor in this with your money management strategy.
Lets get started
Remember...
Don't forget to subscribe / LIKE and hit the notification bell and review the PETESINVESTING channel playlists for further reference.
16
views

BITCOIN Technical Analysis Feb 27 2024
BITCOIN Technical Analysis Feb 27, 2024 using Heiken Ashi and Commodity Channel Index.
Welcome to Pete’s investing updates
in this strategy edition we will be talking about trading using the Commodity Channel Index Indicator with a weighted moving average, and applying a % Gain and Average Down approach.
#BTC #BITI #MARA #RIOT #BITCOIN #ASX200 #sharetrading #averagedown #MovingAverage #CCI #CommodityChannelIndex #divergence #HeikenAshi
Become a PetesInvesting Patreon member with weekly scans on
https://www.patreon.com/petesinvesting
Pete's Multiple Indicator Indicator
https://youtu.be/2uGsgJ54DNw?si=qk7Ylq8R7Lw2LNNS
Multiple Moving Average on Price and CCI150
https://youtu.be/CFvryakYpZo?si=O8kxDoEA0OAl5IRt
Mult MA Oscillator strategy
https://youtu.be/u7gC6uFLskM
Don't forget...
First always remember to review petesinvesting channel playlists
Updated every weekend I look at the charts of some select blue chip shares as well as some key world sharemarket indices.
As always click on the SUBSCRIBE button as well as the NOTIFICATION bell and LIKE this video to support this channel.
If you want me to review an Index a share, a commodity or a FOREX pair, put it in the comments and I'll cover it in a future video
Things
to consider:
•We track and trade on a Daily chart since we want to back test and see results of trades back during the GFC as well as Covid effects.
•We track and back test Revenue over Drawdown requirements
(as a %) to optimize our returns with less exposure.
•Brokerage is included in our back testing. I use $8 per transaction each time we buy or sell. Revenue shown may change slightly depending on your brokerage costs.
•Our Back testing transacts with $2,000 per trade. ie everytime you purchase $2k worth of shares in the instrument you want to invest.
To increase Revenue (ie returns) simply increase this. But beware this will also increase your Drawdown, so ensure you factor in this with your money management strategy.
Lets get started
Remember...
Don't forget to subscribe / LIKE and hit the notification bell and review the PETESINVESTING channel playlists for further reference.
21
views
NIKKEI update Feb 26 2024
NIKKEI update Feb 26, 2024.
Welcome to Pete’s investing updates
in this strategy edition we will be talking about trading using the Commodity Channel Index Indicator with a weighted moving average, and applying a % Gain and Average Down approach.
#NIKKEI #sharetrading #averagedown #MovingAverage #CCI #CommodityChannelIndex #divergence
Become a PetesInvesting Patreon member with weekly scans on
https://www.patreon.com/petesinvesting
Pete's Multiple Indicator Indicator
https://youtu.be/2uGsgJ54DNw?si=qk7Ylq8R7Lw2LNNS
Multiple Moving Average on Price and CCI150
https://youtu.be/CFvryakYpZo?si=O8kxDoEA0OAl5IRt
Mult MA Oscillator strategy
https://youtu.be/u7gC6uFLskM
Don't forget...
First always remember to review petesinvesting channel playlists
Updated every weekend I look at the charts of some select blue chip shares as well as some key world sharemarket indices.
As always click on the SUBSCRIBE button as well as the NOTIFICATION bell and LIKE this video to support this channel.
If you want me to review an Index a share, a commodity or a FOREX pair, put it in the comments and I'll cover it in a future video
Things
to consider:
•We track and trade on a Daily chart since we want to back test and see results of trades back during the GFC as well as Covid effects.
•We track and back test Revenue over Drawdown requirements
(as a %) to optimize our returns with less exposure.
•Brokerage is included in our back testing. I use $8 per transaction each time we buy or sell. Revenue shown may change slightly depending on your brokerage costs.
•Our Back testing transacts with $2,000 per trade. ie everytime you purchase $2k worth of shares in the instrument you want to invest.
To increase Revenue (ie returns) simply increase this. But beware this will also increase your Drawdown, so ensure you factor in this with your money management strategy.
Lets get started
Remember...
Don't forget to subscribe / LIKE and hit the notification bell and review the PETESINVESTING channel playlists for further reference.
Using a Daily price chart, we review the weekly progress of a sample of Bluechip stocks from Australia, the US and Europe - Telefonica (TEF.BME), Commonwealth Bank Of Australia (CBA.AX), BHP Group Ltd Australia (BHP.AX), JPMorgan and Chase (JPM.NYSE), Volkswagen AG (VOW.XETRA), Johnson & Johnson (JNJ.NYSE), Caterpillar Inc (CAT.NYSE).
Showing any new open and closed positions, profitability and draw down requirements dependent on the trend of the respective price charts.
36
views
US and Brent Crude Oil and BPT Technical Analysis Feb 26 2024
US and Brent Crude Oil BPT Technical Analysis Feb 26, 2024
Using Stochastic and Commodity Channel Index.
Welcome to Pete’s investing updates
in this strategy edition we will be talking about trading using the Commodity Channel Index Indicator with a weighted moving average, and applying a % Gain and Average Down approach.
#BPT #BPPrudhoeBayRoyaltyTrust #USCrudeOil #BrentCrudeOil #sharetrading #averagedown #MovingAverage #CCI #CommodityChannelIndex #divergence
Become a PetesInvesting Patreon member with weekly scans on
https://www.patreon.com/petesinvesting
Mult MA Oscillator strategy
https://youtu.be/u7gC6uFLskM
Pete's Multiple Indicator Indicator
https://youtu.be/2uGsgJ54DNw?si=qk7Ylq8R7Lw2LNNS
Don't forget...
First always remember to review petesinvesting channel playlists
Updated every weekend I look at the charts of some select blue chip shares as well as some key world sharemarket indices.
As always click on the SUBSCRIBE button as well as the NOTIFICATION bell and LIKE this video to support this channel.
If you want me to review an Index a share, a commodity or a FOREX pair, put it in the comments and I'll cover it in a future video
Things
to consider:
•We track and trade on a Daily chart since we want to back test and see results of trades back during the GFC as well as Covid effects.
•We track and back test Revenue over Drawdown requirements
(as a %) to optimize our returns with less exposure.
•Brokerage is included in our back testing. I use $8 per transaction each time we buy or sell. Revenue shown may change slightly depending on your brokerage costs.
•Our Back testing transacts with $2,000 per trade. ie everytime you purchase $2k worth of shares in the instrument you want to invest.
To increase Revenue (ie returns) simply increase this. But beware this will also increase your Drawdown, so ensure you factor in this with your money management strategy.
Lets get started
Remember...
Don't forget to subscribe / LIKE and hit the notification bell and review the PETESINVESTING channel playlists for further reference.
13
views
Natural Gas BOIL UNG KOLD Technical Analysis Feb 26 2024
Natural Gas Technical Analysis (BOIL, UNG, KOLD) Feb 26, 2024
Welcome to Pete’s investing updates
in this strategy edition we will be talking about trading using the Commodity Channel Index Indicator with a weighted moving average, and applying a % Gain and Average Down approach.
#NaturalGas #sharetrading #averagedown #MovingAverage #CCI #CommodityChannelIndex #divergence #TradingIdea
Become a PetesInvesting Patreon member with weekly scans on
https://www.patreon.com/petesinvesting
Pete's Multiple Indicator Indicator
https://youtu.be/2uGsgJ54DNw?si=qk7Ylq8R7Lw2LNNS
Multiple Moving Average on Price and CCI150
https://youtu.be/CFvryakYpZo?si=O8kxDoEA0OAl5IRt
Mult MA Oscillator strategy
https://youtu.be/u7gC6uFLskM
Don't forget...
First always remember to review petesinvesting channel playlists
Updated every weekend I look at the charts of some select blue chip shares as well as some key world sharemarket indices.
As always click on the SUBSCRIBE button as well as the NOTIFICATION bell and LIKE this video to support this channel.
If you want me to review an Index a share, a commodity or a FOREX pair, put it in the comments and I'll cover it in a future video
Things
to consider:
•We track and trade on a Daily chart since we want to back test and see results of trades back during the GFC as well as Covid effects.
•We track and back test Revenue over Drawdown requirements
(as a %) to optimize our returns with less exposure.
•Brokerage is included in our back testing. I use $8 per transaction each time we buy or sell. Revenue shown may change slightly depending on your brokerage costs.
•Our Back testing transacts with $2,000 per trade. ie everytime you purchase $2k worth of shares in the instrument you want to invest.
To increase Revenue (ie returns) simply increase this. But beware this will also increase your Drawdown, so ensure you factor in this with your money management strategy.
Lets get started
Remember...
Don't forget to subscribe / LIKE and hit the notification bell and review the PETESINVESTING channel playlists for further reference.
Supporting videos:
Become a PetesInvesting Patreon member with same day updates on
https://www.patreon.com/petesinvesting
23
views
NASDAQ Technical Analysis Feb 24 2024
NASDAQ Technical Analysis Feb 24, 2024
Welcome to Pete’s investing updates
in this strategy edition we will be talking about trading using the Commodity Channel Index Indicator with a weighted moving average, and applying a % Gain and Average Down approach.
#NASDAQ #ASX200 #sharetrading #averagedown #MovingAverage #CCI #CommodityChannelIndex #divergence
Become a PetesInvesting Patreon member with weekly scans on
https://www.patreon.com/petesinvesting
Pete's Multiple Indicator Indicator
https://youtu.be/2uGsgJ54DNw?si=qk7Ylq8R7Lw2LNNS
Multiple Moving Average on Price and CCI150
https://youtu.be/CFvryakYpZo?si=O8kxDoEA0OAl5IRt
Mult MA Oscillator strategy
https://youtu.be/u7gC6uFLskM
Don't forget...
First always remember to review petesinvesting channel playlists
Updated every weekend I look at the charts of some select blue chip shares as well as some key world sharemarket indices.
As always click on the SUBSCRIBE button as well as the NOTIFICATION bell and LIKE this video to support this channel.
If you want me to review an Index a share, a commodity or a FOREX pair, put it in the comments and I'll cover it in a future video
Things
to consider:
•We track and trade on a Daily chart since we want to back test and see results of trades back during the GFC as well as Covid effects.
•We track and back test Revenue over Drawdown requirements
(as a %) to optimize our returns with less exposure.
•Brokerage is included in our back testing. I use $8 per transaction each time we buy or sell. Revenue shown may change slightly depending on your brokerage costs.
•Our Back testing transacts with $2,000 per trade. ie everytime you purchase $2k worth of shares in the instrument you want to invest.
To increase Revenue (ie returns) simply increase this. But beware this will also increase your Drawdown, so ensure you factor in this with your money management strategy.
Lets get started
Remember...
Don't forget to subscribe / LIKE and hit the notification bell and review the PETESINVESTING channel playlists for further reference.
50
views
Natural Gas BOIL UNG KOLD Technical Analysis Feb 24 2024
Natural Gas Technical Analysis (BOIL, UNG, KOLD) Feb 24, 2024
Welcome to Pete’s investing updates
in this strategy edition we will be talking about trading using the Commodity Channel Index Indicator with a weighted moving average, and applying a % Gain and Average Down approach.
#NaturalGas #sharetrading #averagedown #MovingAverage #CCI #CommodityChannelIndex #divergence #TradingIdea
Become a PetesInvesting Patreon member with weekly scans on
https://www.patreon.com/petesinvesting
Pete's Multiple Indicator Indicator
https://youtu.be/2uGsgJ54DNw?si=qk7Ylq8R7Lw2LNNS
Multiple Moving Average on Price and CCI150
https://youtu.be/CFvryakYpZo?si=O8kxDoEA0OAl5IRt
Mult MA Oscillator strategy
https://youtu.be/u7gC6uFLskM
Don't forget...
First always remember to review petesinvesting channel playlists
Updated every weekend I look at the charts of some select blue chip shares as well as some key world sharemarket indices.
As always click on the SUBSCRIBE button as well as the NOTIFICATION bell and LIKE this video to support this channel.
If you want me to review an Index a share, a commodity or a FOREX pair, put it in the comments and I'll cover it in a future video
Things
to consider:
•We track and trade on a Daily chart since we want to back test and see results of trades back during the GFC as well as Covid effects.
•We track and back test Revenue over Drawdown requirements
(as a %) to optimize our returns with less exposure.
•Brokerage is included in our back testing. I use $8 per transaction each time we buy or sell. Revenue shown may change slightly depending on your brokerage costs.
•Our Back testing transacts with $2,000 per trade. ie everytime you purchase $2k worth of shares in the instrument you want to invest.
To increase Revenue (ie returns) simply increase this. But beware this will also increase your Drawdown, so ensure you factor in this with your money management strategy.
Lets get started
Remember...
Don't forget to subscribe / LIKE and hit the notification bell and review the PETESINVESTING channel playlists for further reference.
Supporting videos:
Become a PetesInvesting Patreon member with same day updates on
https://www.patreon.com/petesinvesting
25
views
German DAX update Feb 23 2024
German DAX update Feb 23, 2024
Welcome to Pete’s investing updates
in this strategy edition we will be talking about trading using the Commodity Channel Index Indicator with a weighted moving average, and applying a % Gain and Average Down approach.
#GermanDAX #sharetrading #averagedown #MovingAverage #CCI #CommodityChannelIndex
Become a PetesInvesting Patreon member with same day updates on
https://www.patreon.com/petesinvesting
Become a PetesInvesting Patreon member with weekly scans on
https://www.patreon.com/petesinvesting
Pete's Multiple Indicator Indicator
https://youtu.be/2uGsgJ54DNw?si=qk7Ylq8R7Lw2LNNS
Multiple Moving Average on Price and CCI150
https://youtu.be/CFvryakYpZo?si=O8kxDoEA0OAl5IRt
Mult MA Oscillator strategy
https://youtu.be/u7gC6uFLskM
PART 2 CCI1500 and MA400 with Moving Average Difference
https://youtu.be/qdxp-QlWl1g
CCI350 Commodity Channel Index strategy
https://youtu.be/xEqQkeI4aUE
A Very Simple Moving Average (EMA9 MA20)
https://youtu.be/k9FStX2ke9g
Stochastic trading strategy quickie
https://youtu.be/RgFcN0zewjY
Don't forget...
First always remember to review petesinvesting channel playlists
Updated every weekend I look at the charts of some select blue chip shares as well as some key world sharemarket indices.
As always click on the SUBSCRIBE button as well as the NOTIFICATION bell and LIKE this video to support this channel.
If you want me to review an Index a share, a commodity or a FOREX pair, put it in the comments and I'll cover it in a future video
Things
to consider:
•We track and trade on a Daily chart since we want to back test and see results of trades back during the GFC as well as Covid effects.
•We track and back test Revenue over Drawdown requirements
(as a %) to optimize our returns with less exposure.
•Brokerage is included in our back testing. I use $8 per transaction each time we buy or sell. Revenue shown may change slightly depending on your brokerage costs.
•Our Back testing transacts with $2,000 per trade. ie everytime you purchase $2k worth of shares in the instrument you want to invest.
To increase Revenue (ie returns) simply increase this. But beware this will also increase your Drawdown, so ensure you factor in this with your money management strategy.
Lets get started
Remember...
Don't forget to subscribe / LIKE and hit the notification bell and review the PETESINVESTING channel playlists for further reference.
Using a Daily price chart, we review the weekly progress of a sample of Bluechip stocks from Australia, the US and Europe - Telefonica (TEF.BME), Commonwealth Bank Of Australia (CBA.AX), BHP Group Ltd Australia (BHP.AX), JPMorgan and Chase (JPM.NYSE), Volkswagen AG (VOW.XETRA), Johnson & Johnson (JNJ.NYSE), Caterpillar Inc (CAT.NYSE).
Showing any new open and closed positions, profitability and draw down requirements dependent on the trend of the respective price charts.
Supporting videos:
Become a PetesInvesting Patreon member with same day updates on
https://www.patreon.com/petesinvesting
Alligator strategy explained:
https://youtu.be/1SMSRQV7GZE
Rumble updates
https://rumble.com/register/peteeight/
Bitchute updates:
https://www.bitchute.com/channel/pTjWs2A7K9Br/
Money Management:
https://youtu.be/nvvcldeeZS4
Average Down Do's and Don'ts
https://youtu.be/SZbh2Me4kq0
Simple Trading Strategy with CCI and Avg Down technique
https://youtu.be/w35_YtV4YQU
Simple trading strategy https://youtu.be/ibVzRwCX-3Q
Average Down Strategy https://youtu.be/RFCb5S78D8o
44
views
1
comment

Natural Gas BOIL UNG KOLD Technical Analysis Feb 23 2024
Natural Gas Technical Analysis (BOIL, UNG, KOLD) Feb 23, 2024
Welcome to Pete’s investing updates
in this strategy edition we will be talking about trading using the Commodity Channel Index Indicator with a weighted moving average, and applying a % Gain and Average Down approach.
#NaturalGas #sharetrading #averagedown #MovingAverage #CCI #CommodityChannelIndex #divergence #TradingIdea
Become a PetesInvesting Patreon member with weekly scans on
https://www.patreon.com/petesinvesting
Pete's Multiple Indicator Indicator
https://youtu.be/2uGsgJ54DNw?si=qk7Ylq8R7Lw2LNNS
Multiple Moving Average on Price and CCI150
https://youtu.be/CFvryakYpZo?si=O8kxDoEA0OAl5IRt
Mult MA Oscillator strategy
https://youtu.be/u7gC6uFLskM
Don't forget...
First always remember to review petesinvesting channel playlists
Updated every weekend I look at the charts of some select blue chip shares as well as some key world sharemarket indices.
As always click on the SUBSCRIBE button as well as the NOTIFICATION bell and LIKE this video to support this channel.
If you want me to review an Index a share, a commodity or a FOREX pair, put it in the comments and I'll cover it in a future video
Things
to consider:
•We track and trade on a Daily chart since we want to back test and see results of trades back during the GFC as well as Covid effects.
•We track and back test Revenue over Drawdown requirements
(as a %) to optimize our returns with less exposure.
•Brokerage is included in our back testing. I use $8 per transaction each time we buy or sell. Revenue shown may change slightly depending on your brokerage costs.
•Our Back testing transacts with $2,000 per trade. ie everytime you purchase $2k worth of shares in the instrument you want to invest.
To increase Revenue (ie returns) simply increase this. But beware this will also increase your Drawdown, so ensure you factor in this with your money management strategy.
Lets get started
Remember...
Don't forget to subscribe / LIKE and hit the notification bell and review the PETESINVESTING channel playlists for further reference.
Supporting videos:
Become a PetesInvesting Patreon member with same day updates on
https://www.patreon.com/petesinvesting
19
views

German DAX update Feb 22 2024
German DAX update Feb 22, 2024
Welcome to Pete’s investing updates
in this strategy edition we will be talking about trading using the Commodity Channel Index Indicator with a weighted moving average, and applying a % Gain and Average Down approach.
#GermanDAX #sharetrading #averagedown #MovingAverage #CCI #CommodityChannelIndex
Become a PetesInvesting Patreon member with same day updates on
https://www.patreon.com/petesinvesting
Become a PetesInvesting Patreon member with weekly scans on
https://www.patreon.com/petesinvesting
Pete's Multiple Indicator Indicator
https://youtu.be/2uGsgJ54DNw?si=qk7Ylq8R7Lw2LNNS
Multiple Moving Average on Price and CCI150
https://youtu.be/CFvryakYpZo?si=O8kxDoEA0OAl5IRt
Mult MA Oscillator strategy
https://youtu.be/u7gC6uFLskM
PART 2 CCI1500 and MA400 with Moving Average Difference
https://youtu.be/qdxp-QlWl1g
CCI350 Commodity Channel Index strategy
https://youtu.be/xEqQkeI4aUE
A Very Simple Moving Average (EMA9 MA20)
https://youtu.be/k9FStX2ke9g
Stochastic trading strategy quickie
https://youtu.be/RgFcN0zewjY
Don't forget...
First always remember to review petesinvesting channel playlists
Updated every weekend I look at the charts of some select blue chip shares as well as some key world sharemarket indices.
As always click on the SUBSCRIBE button as well as the NOTIFICATION bell and LIKE this video to support this channel.
If you want me to review an Index a share, a commodity or a FOREX pair, put it in the comments and I'll cover it in a future video
Things
to consider:
•We track and trade on a Daily chart since we want to back test and see results of trades back during the GFC as well as Covid effects.
•We track and back test Revenue over Drawdown requirements
(as a %) to optimize our returns with less exposure.
•Brokerage is included in our back testing. I use $8 per transaction each time we buy or sell. Revenue shown may change slightly depending on your brokerage costs.
•Our Back testing transacts with $2,000 per trade. ie everytime you purchase $2k worth of shares in the instrument you want to invest.
To increase Revenue (ie returns) simply increase this. But beware this will also increase your Drawdown, so ensure you factor in this with your money management strategy.
Lets get started
Remember...
Don't forget to subscribe / LIKE and hit the notification bell and review the PETESINVESTING channel playlists for further reference.
Using a Daily price chart, we review the weekly progress of a sample of Bluechip stocks from Australia, the US and Europe - Telefonica (TEF.BME), Commonwealth Bank Of Australia (CBA.AX), BHP Group Ltd Australia (BHP.AX), JPMorgan and Chase (JPM.NYSE), Volkswagen AG (VOW.XETRA), Johnson & Johnson (JNJ.NYSE), Caterpillar Inc (CAT.NYSE).
Showing any new open and closed positions, profitability and draw down requirements dependent on the trend of the respective price charts.
Supporting videos:
Become a PetesInvesting Patreon member with same day updates on
https://www.patreon.com/petesinvesting
Alligator strategy explained:
https://youtu.be/1SMSRQV7GZE
Rumble updates
https://rumble.com/register/peteeight/
Bitchute updates:
https://www.bitchute.com/channel/pTjWs2A7K9Br/
Money Management:
https://youtu.be/nvvcldeeZS4
Average Down Do's and Don'ts
https://youtu.be/SZbh2Me4kq0
Simple Trading Strategy with CCI and Avg Down technique
https://youtu.be/w35_YtV4YQU
Simple trading strategy https://youtu.be/ibVzRwCX-3Q
Average Down Strategy https://youtu.be/RFCb5S78D8o
22
views
High Grade Copper Technical Analysis Feb 22 2024
High Grade Copper Technical Analysis Feb 22, 2024.
Welcome to Pete’s investing updates
in this strategy edition we will be talking about trading using the Commodity Channel Index Indicator with a weighted moving average, and applying a % Gain and Average Down approach.
#HG #HighGradeCopper #sharetrading #averagedown #MovingAverage #CCI #CommodityChannelIndex #divergence
Become a PetesInvesting Patreon member with same day updates on
https://www.patreon.com/petesinvesting
Pete's Multiple Indicator Indicator
https://youtu.be/2uGsgJ54DNw?si=qk7Ylq8R7Lw2LNNS
Multiple Moving Average on Price and CCI150
https://youtu.be/CFvryakYpZo?si=O8kxDoEA0OAl5IRt
Mult MA Oscillator strategy
https://youtu.be/u7gC6uFLskM
Don't forget...
First always remember to review petesinvesting channel playlists
Updated every weekend I look at the charts of some select blue chip shares as well as some key world sharemarket indices.
As always click on the SUBSCRIBE button as well as the NOTIFICATION bell and LIKE this video to support this channel.
If you want me to review an Index a share, a commodity or a FOREX pair, put it in the comments and I'll cover it in a future video
Things
to consider:
•We track and trade on a Daily chart since we want to back test and see results of trades back during the GFC as well as Covid effects.
•We track and back test Revenue over Drawdown requirements
(as a %) to optimize our returns with less exposure.
•Brokerage is included in our back testing. I use $8 per transaction each time we buy or sell. Revenue shown may change slightly depending on your brokerage costs.
•Our Back testing transacts with $2,000 per trade. ie everytime you purchase $2k worth of shares in the instrument you want to invest.
To increase Revenue (ie returns) simply increase this. But beware this will also increase your Drawdown, so ensure you factor in this with your money management strategy.
Lets get started
Remember...
Don't forget to subscribe / LIKE and hit the notification bell and review the PETESINVESTING channel playlists for further reference.
10
views
Natural Gas BOIL UNG KOLD Technical Analysis Feb 22 2024
Natural Gas Technical Analysis (BOIL, UNG, KOLD) Feb 22, 2024
Welcome to Pete’s investing updates
in this strategy edition we will be talking about trading using the Commodity Channel Index Indicator with a weighted moving average, and applying a % Gain and Average Down approach.
#NaturalGas #sharetrading #averagedown #MovingAverage #CCI #CommodityChannelIndex #divergence #TradingIdea
Become a PetesInvesting Patreon member with weekly scans on
https://www.patreon.com/petesinvesting
Pete's Multiple Indicator Indicator
https://youtu.be/2uGsgJ54DNw?si=qk7Ylq8R7Lw2LNNS
Multiple Moving Average on Price and CCI150
https://youtu.be/CFvryakYpZo?si=O8kxDoEA0OAl5IRt
Mult MA Oscillator strategy
https://youtu.be/u7gC6uFLskM
Don't forget...
First always remember to review petesinvesting channel playlists
Updated every weekend I look at the charts of some select blue chip shares as well as some key world sharemarket indices.
As always click on the SUBSCRIBE button as well as the NOTIFICATION bell and LIKE this video to support this channel.
If you want me to review an Index a share, a commodity or a FOREX pair, put it in the comments and I'll cover it in a future video
Things
to consider:
•We track and trade on a Daily chart since we want to back test and see results of trades back during the GFC as well as Covid effects.
•We track and back test Revenue over Drawdown requirements
(as a %) to optimize our returns with less exposure.
•Brokerage is included in our back testing. I use $8 per transaction each time we buy or sell. Revenue shown may change slightly depending on your brokerage costs.
•Our Back testing transacts with $2,000 per trade. ie everytime you purchase $2k worth of shares in the instrument you want to invest.
To increase Revenue (ie returns) simply increase this. But beware this will also increase your Drawdown, so ensure you factor in this with your money management strategy.
Lets get started
Remember...
Don't forget to subscribe / LIKE and hit the notification bell and review the PETESINVESTING channel playlists for further reference.
Supporting videos:
Become a PetesInvesting Patreon member with same day updates on
https://www.patreon.com/petesinvesting
20
views
Multiple Moving Average on Price and CCI150 Feb 21, 2024.
Multiple Moving Average on Price and CCI150 Feb 21, 2024.
Welcome to Pete’s investing updates
in this strategy edition we will be talking about trading using the Commodity Channel Index Indicator with a moving average, and applying a % Gain and Average Down approach.
#CCI150 #sharetrading #averagedown #MovingAverage #CCI #CommodityChannelIndex #divergence
Become a PetesInvesting Patreon member with weekly scans on
https://www.patreon.com/petesinvesting
Mult MA Oscillator strategy
https://youtu.be/u7gC6uFLskM
Pete's Multiple Indicator Indicator
https://youtu.be/2uGsgJ54DNw?si=qk7Ylq8R7Lw2LNNS
Don't forget...
First always remember to review petesinvesting channel playlists
Updated every weekend I look at the charts of some select blue chip shares as well as some key world sharemarket indices.
As always click on the SUBSCRIBE button as well as the NOTIFICATION bell and LIKE this video to support this channel.
If you want me to review an Index a share, a commodity or a FOREX pair, put it in the comments and I'll cover it in a future video
Things
to consider:
•We track and trade on a Daily chart since we want to back test and see results of trades back during the GFC as well as Covid effects.
•We track and back test Revenue over Drawdown requirements
(as a %) to optimize our returns with less exposure.
•Brokerage is included in our back testing. I use $8 per transaction each time we buy or sell. Revenue shown may change slightly depending on your brokerage costs.
•Our Back testing transacts with $2,000 per trade. ie everytime you purchase $2k worth of shares in the instrument you want to invest.
To increase Revenue (ie returns) simply increase this. But beware this will also increase your Drawdown, so ensure you factor in this with your money management strategy.
Lets get started
Remember...
Don't forget to subscribe / LIKE and hit the notification bell and review the PETESINVESTING channel playlists for further reference.
31
views
US and Brent Crude Oil and BPT Technical Analysis Feb 21 2024
US and Brent Crude Oil BPT Technical Analysis Feb 21, 2024
Using Stochastic and Commodity Channel Index.
Welcome to Pete’s investing updates
in this strategy edition we will be talking about trading using the Commodity Channel Index Indicator with a weighted moving average, and applying a % Gain and Average Down approach.
#BPT #BPPrudhoeBayRoyaltyTrust #USCrudeOil #BrentCrudeOil #sharetrading #averagedown #MovingAverage #CCI #CommodityChannelIndex #divergence
Become a PetesInvesting Patreon member with weekly scans on
https://www.patreon.com/petesinvesting
Mult MA Oscillator strategy
https://youtu.be/u7gC6uFLskM
Pete's Multiple Indicator Indicator
https://youtu.be/2uGsgJ54DNw?si=qk7Ylq8R7Lw2LNNS
Don't forget...
First always remember to review petesinvesting channel playlists
Updated every weekend I look at the charts of some select blue chip shares as well as some key world sharemarket indices.
As always click on the SUBSCRIBE button as well as the NOTIFICATION bell and LIKE this video to support this channel.
If you want me to review an Index a share, a commodity or a FOREX pair, put it in the comments and I'll cover it in a future video
Things
to consider:
•We track and trade on a Daily chart since we want to back test and see results of trades back during the GFC as well as Covid effects.
•We track and back test Revenue over Drawdown requirements
(as a %) to optimize our returns with less exposure.
•Brokerage is included in our back testing. I use $8 per transaction each time we buy or sell. Revenue shown may change slightly depending on your brokerage costs.
•Our Back testing transacts with $2,000 per trade. ie everytime you purchase $2k worth of shares in the instrument you want to invest.
To increase Revenue (ie returns) simply increase this. But beware this will also increase your Drawdown, so ensure you factor in this with your money management strategy.
Lets get started
Remember...
Don't forget to subscribe / LIKE and hit the notification bell and review the PETESINVESTING channel playlists for further reference.
11
views
Natural Gas BOIL UNG KOLD Technical Analysis Feb 21 2024
Natural Gas Technical Analysis (BOIL, UNG, KOLD) Feb 21, 2024
Welcome to Pete’s investing updates
in this strategy edition we will be talking about trading using the Commodity Channel Index Indicator with a weighted moving average, and applying a % Gain and Average Down approach.
#NaturalGas #sharetrading #averagedown #MovingAverage #CCI #CommodityChannelIndex #divergence #TradingIdea
Become a PetesInvesting Patreon member with weekly scans on
https://www.patreon.com/petesinvesting
Mult MA Oscillator strategy
https://youtu.be/u7gC6uFLskM
Pete's Multiple Indicator Indicator
https://youtu.be/2uGsgJ54DNw?si=qk7Ylq8R7Lw2LNNS
Don't forget...
First always remember to review petesinvesting channel playlists
Updated every weekend I look at the charts of some select blue chip shares as well as some key world sharemarket indices.
As always click on the SUBSCRIBE button as well as the NOTIFICATION bell and LIKE this video to support this channel.
If you want me to review an Index a share, a commodity or a FOREX pair, put it in the comments and I'll cover it in a future video
Things
to consider:
•We track and trade on a Daily chart since we want to back test and see results of trades back during the GFC as well as Covid effects.
•We track and back test Revenue over Drawdown requirements
(as a %) to optimize our returns with less exposure.
•Brokerage is included in our back testing. I use $8 per transaction each time we buy or sell. Revenue shown may change slightly depending on your brokerage costs.
•Our Back testing transacts with $2,000 per trade. ie everytime you purchase $2k worth of shares in the instrument you want to invest.
To increase Revenue (ie returns) simply increase this. But beware this will also increase your Drawdown, so ensure you factor in this with your money management strategy.
Lets get started
Remember...
Don't forget to subscribe / LIKE and hit the notification bell and review the PETESINVESTING channel playlists for further reference.
Supporting videos:
Become a PetesInvesting Patreon member with same day updates on
https://www.patreon.com/petesinvesting
19
views
US and Brent Crude Oil and BPT Technical Analysis Feb 20 2024
US and Brent Crude Oil BPT Technical Analysis Feb 20, 2024
Using Stochastic and Commodity Channel Index.
Welcome to Pete’s investing updates
in this strategy edition we will be talking about trading using the Commodity Channel Index Indicator with a weighted moving average, and applying a % Gain and Average Down approach.
#BPT #BPPrudhoeBayRoyaltyTrust #USCrudeOil #BrentCrudeOil #sharetrading #averagedown #MovingAverage #CCI #CommodityChannelIndex #divergence
Become a PetesInvesting Patreon member with weekly scans on
https://www.patreon.com/petesinvesting
Mult MA Oscillator strategy
https://youtu.be/u7gC6uFLskM
Pete's Multiple Indicator Indicator
https://youtu.be/2uGsgJ54DNw?si=qk7Ylq8R7Lw2LNNS
Don't forget...
First always remember to review petesinvesting channel playlists
Updated every weekend I look at the charts of some select blue chip shares as well as some key world sharemarket indices.
As always click on the SUBSCRIBE button as well as the NOTIFICATION bell and LIKE this video to support this channel.
If you want me to review an Index a share, a commodity or a FOREX pair, put it in the comments and I'll cover it in a future video
Things
to consider:
•We track and trade on a Daily chart since we want to back test and see results of trades back during the GFC as well as Covid effects.
•We track and back test Revenue over Drawdown requirements
(as a %) to optimize our returns with less exposure.
•Brokerage is included in our back testing. I use $8 per transaction each time we buy or sell. Revenue shown may change slightly depending on your brokerage costs.
•Our Back testing transacts with $2,000 per trade. ie everytime you purchase $2k worth of shares in the instrument you want to invest.
To increase Revenue (ie returns) simply increase this. But beware this will also increase your Drawdown, so ensure you factor in this with your money management strategy.
Lets get started
Remember...
Don't forget to subscribe / LIKE and hit the notification bell and review the PETESINVESTING channel playlists for further reference.
13
views
Natural Gas BOIL UNG KOLD Technical Analysis Feb 20 2024
Natural Gas Technical Analysis (BOIL, UNG, KOLD) Feb 20, 2024
Welcome to Pete’s investing updates
in this strategy edition we will be talking about trading using the Commodity Channel Index Indicator with a weighted moving average, and applying a % Gain and Average Down approach.
#NaturalGas #sharetrading #averagedown #MovingAverage #CCI #CommodityChannelIndex #divergence #TradingIdea
Become a PetesInvesting Patreon member with weekly scans on
https://www.patreon.com/petesinvesting
Mult MA Oscillator strategy
https://youtu.be/u7gC6uFLskM
Pete's Multiple Indicator Indicator
https://youtu.be/2uGsgJ54DNw?si=qk7Ylq8R7Lw2LNNS
Don't forget...
First always remember to review petesinvesting channel playlists
Updated every weekend I look at the charts of some select blue chip shares as well as some key world sharemarket indices.
As always click on the SUBSCRIBE button as well as the NOTIFICATION bell and LIKE this video to support this channel.
If you want me to review an Index a share, a commodity or a FOREX pair, put it in the comments and I'll cover it in a future video
Things
to consider:
•We track and trade on a Daily chart since we want to back test and see results of trades back during the GFC as well as Covid effects.
•We track and back test Revenue over Drawdown requirements
(as a %) to optimize our returns with less exposure.
•Brokerage is included in our back testing. I use $8 per transaction each time we buy or sell. Revenue shown may change slightly depending on your brokerage costs.
•Our Back testing transacts with $2,000 per trade. ie everytime you purchase $2k worth of shares in the instrument you want to invest.
To increase Revenue (ie returns) simply increase this. But beware this will also increase your Drawdown, so ensure you factor in this with your money management strategy.
Lets get started
Remember...
Don't forget to subscribe / LIKE and hit the notification bell and review the PETESINVESTING channel playlists for further reference.
Supporting videos:
Become a PetesInvesting Patreon member with same day updates on
https://www.patreon.com/petesinvesting
8
views